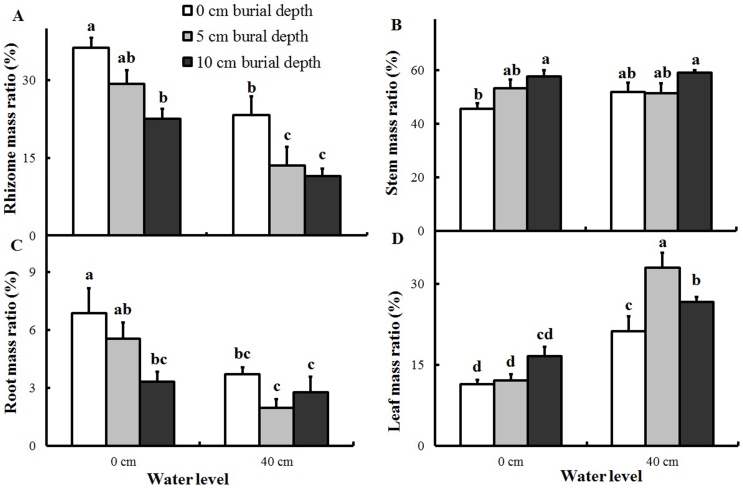
Figure 5. Biomass allocation of Polygonum hydropiper ramets growing at two water levels and three burial depths (mean + S.E., n = 5).
Different letters indicate significant differences among treatments. (A) Rhizome mass ratio. (B) Stem mass ratio. (C) Root mass ratio. (D) Leaf mass ratio. Multiple comparisons of means were performed using Tukey's test at the 0.05 significance level.

