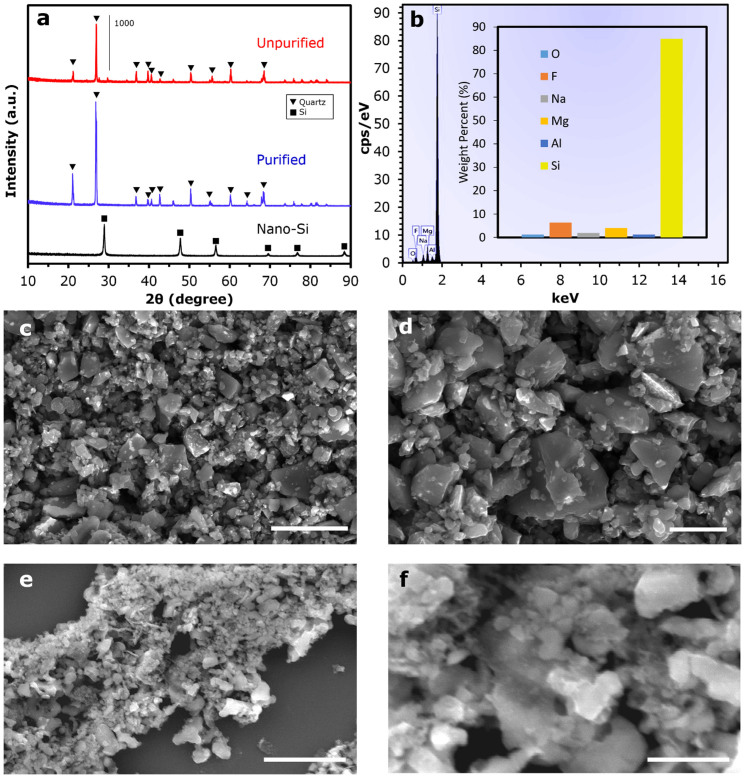
Figure 2.
(a) XRD plot displaying characteristic peaks of quartz in both pre-reduction samples and Si peaks in the post-reduction nano-Si. (b) EDS analysis with inset displaying weight percent of elements in nano-Si after HCl and HF etching. Low magnification (c) and higher magnification (d) SEM images of quartz powder after purification and milling. Low magnification (e) and higher magnification (f) SEM images of nano-Si after reduction and etching. Scale bars for (c),(d), (e), and (f) are 5μm, 2μm, 2μm, and 500 nm, respectively.

