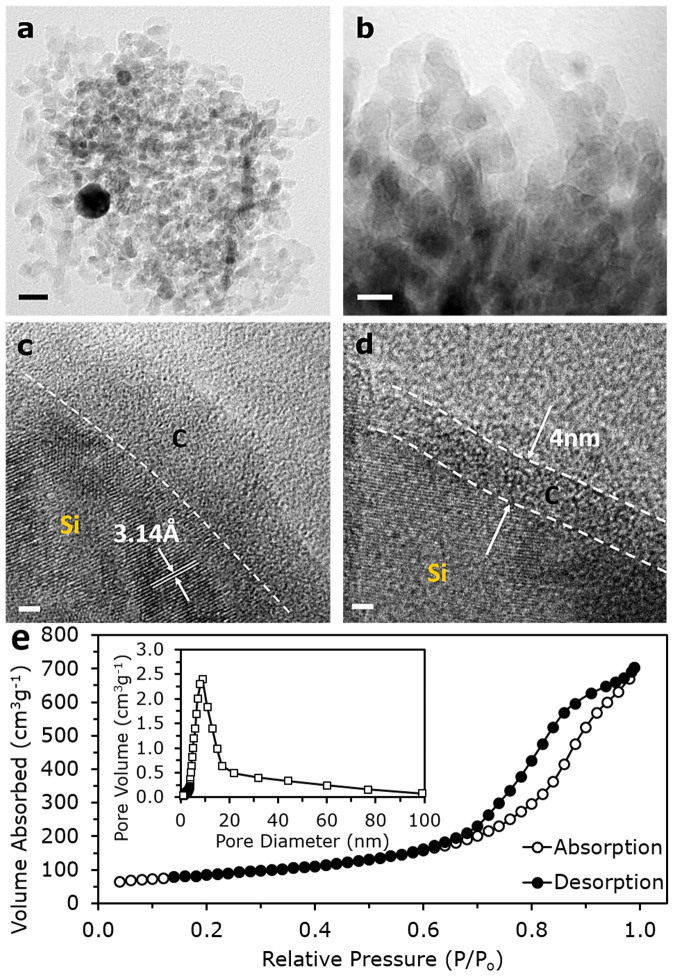
Figure 3.
Low magnification (a) and high magnification (b) TEM images of nano-Si. (c) HRTEM image of nano-Si showing the conformal carbon coating and characteristic lattice spacing of Si(111). (d) HRTEM image of C-coated nano-Si showing thickness of the carbon layer. Scale bars for (a), (b), (c), and (d) are 20 nm, 10 nm, 2 nm, and 2 nm, respectively. (e) BET surface area measurements of nano-Si with type IV N2 sorption isotherms and inset showing pore diameter distribution.

