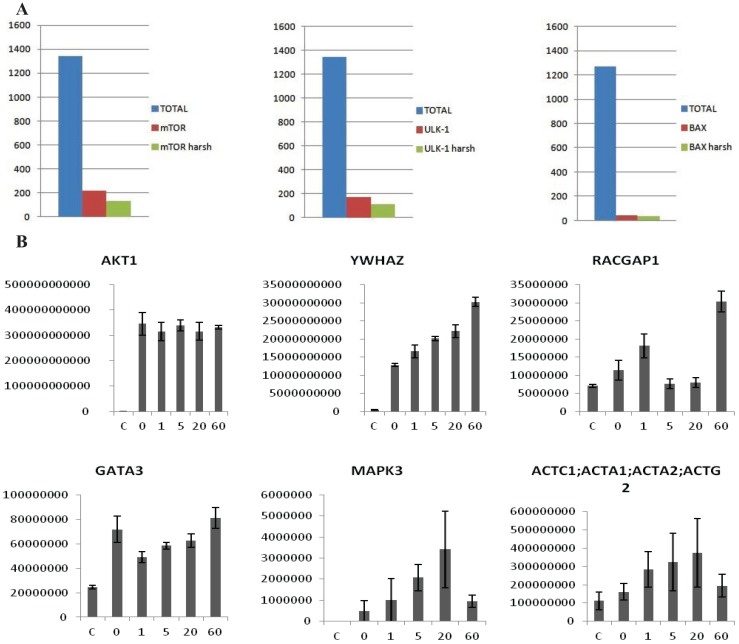
Figure 3.
(A) Examples of MS analysis using the on-beads digestion protocol. The left panel represents a bar graph of the number of proteins identified in an FLAG-mTor IP from HEK293 cells. The graph shows a comparison of the total amount of proteins identified (blue column), the number of potential interactors after statistical analysis (red column), and the number of potential interactors identified only the IP but not in the control (green column). The panel in the middle side depicts the same analysis for V5-ULK1 as bait. The panel on the right hand side depicts the same analysis for BAX (endogenous) as bait. As shown, an average of 1500 total proteins are identified in both cases, about 50–200 appear to be specific interactors after statistical analysis, and around 40–100 are identified in the IPs alone. (B) Dynamic profile of the interaction between Akt1 and select interactors after HRG stimulus in MCF7 cells. MCF7 cells were stimulated with HRG 2 nM for 0, 1, 5, 20 and 60 min. The y-axis represents intensity, the x axis time of HRG-stimulation. The first panel shows that the intensity of the bait (Akt1) is constant across all the points of the time course, while in the other panels show dynamically changing interactors (YWHAZ, RACGAP1, GATA3, MAPK3, ACTC1). Error-bars are SEM, n = 6 or 4 (Akt untreated).

