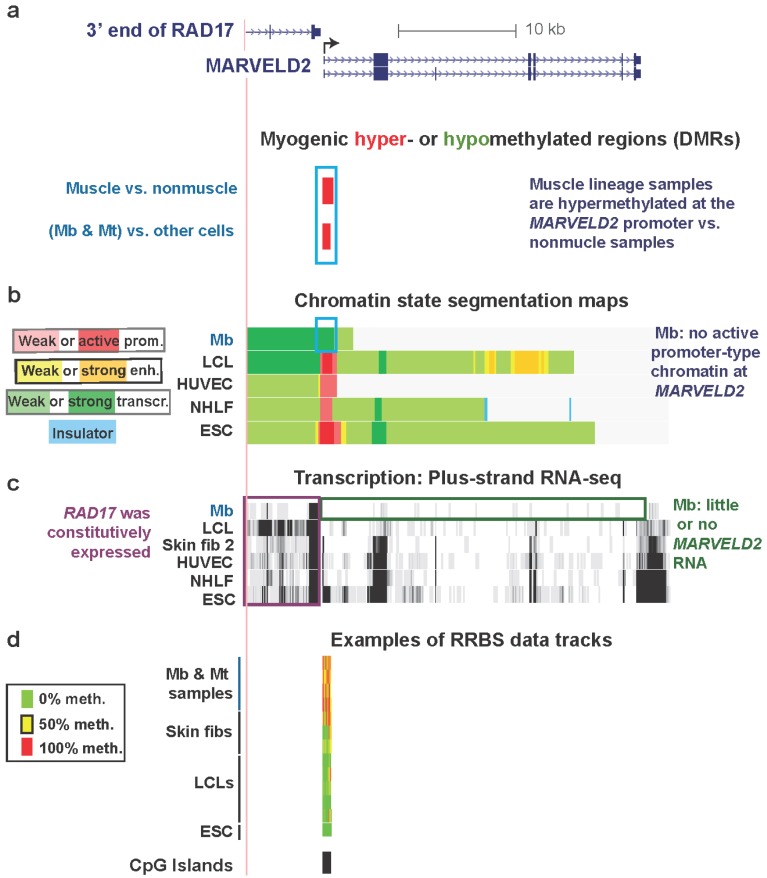
Figure 2.
Myogenic hypermethylation at the silenced promoter of MARVELD2 without repressive chromatin marks. (a) RefSeq genes in this region (chr5:68704307-68740247, hg19) are shown. Only one of nine RAD17 isoforms is illustrated because all isoforms are the same in the 3' region that is depicted. Significantly hypermethylated (red) or hypomethylated (green, none seen) DMRs for the set of (Mb + Mt) samples vs. 16 types of nonmuscle cell cultures and for skeletal muscle vs. 14 types of nonmuscle tissue are aligned under the RefSeq genes. (b) The predicted chromatin structure (enh, enhancer; prom, promoter; transcr, transcriptionally active-type) based mostly on histone modifications [28]. (c) RNA-seq data for the plus-strand (vertical viewing range, 1-to-10). In this region, no specific signal was seen for the minus-strand. (d) Examples of RRBS data and the positions of CGIs. Using an 11-color, semi-continuous scale (see color guide), the RRBS tracks indicate the average DNA methylation levels at each monitored CpG site from the quantitative sequencing data [9,18]. The RRBS data are shown for four independent Mb cultures and Mt preparations from them; one female skin and two foreskin fibroblast cultures; five independent lymphoblastoid cell lines (LCLs), and H1 embryonic stem cells (ESC). The blue, purple, and green boxes indicate noteworthy features. In this and subsequent figures, all tracks are aligned, are from the UCSC Genome Browser [29], and are ENCODE data except for the differential methylation tracks and the MyoD binding tracks in subsequent figures, which are custom tracks.

