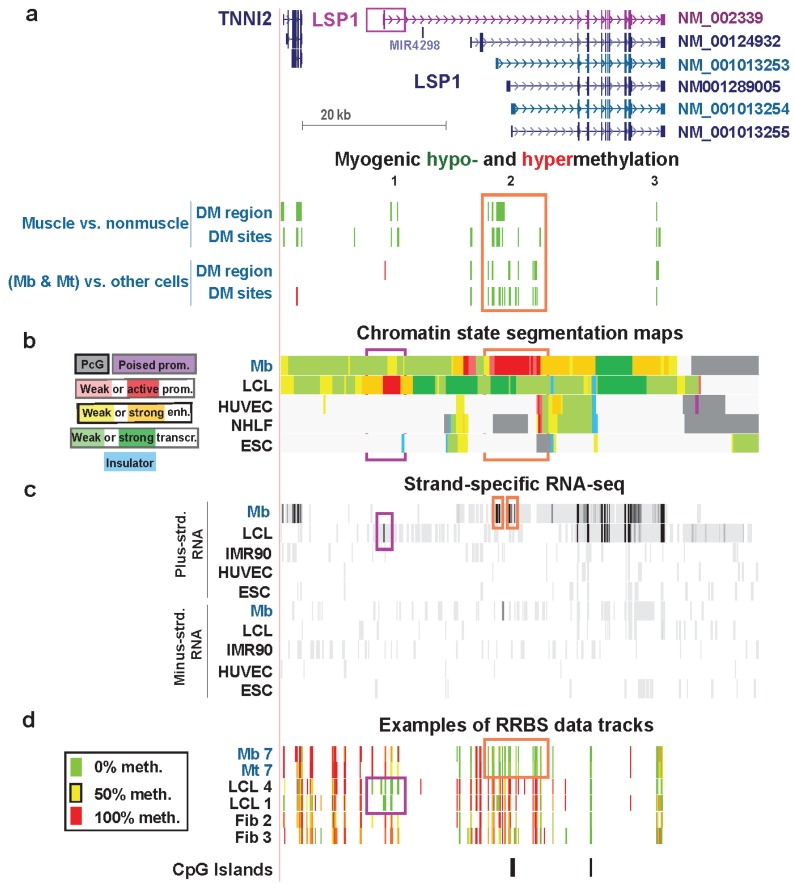
Figure 8.
Myogenic hypomethylation vs. lymphoid hypomethylation at tissue-specific promoters of LSP1. (a) The main RefSeq isoforms detected in Mb and lymphoid cells are shown in blue-green and purple, respectively (chr11:1,859,948-1,926,584). Myogenic differential methylation is indicated as described for Figure 6. (b) Chromatin states are depicted as in previous figures. (c) Strand-specific RNA-seq data are shown for both strands with the vertical viewing range set at 1-to-100. The narrow orange rectangles indicate signal from alternative first exons of LSP1 in Mb. The narrow purple rectangle marks the first LCL exon. In other tracks similar regions are boxed. Previously we concluded that the main LSP1 transcript in Mb was ENST00000405957 [10], which is very similar to RefSeq transcript NM_001013253. However, new RNA-seq profiles (G. Crawford and M. Ehrlich labs [16]), which had greater depth of cDNA sequences for LSP1 and used different Mb samples, indicate that NM_001013254 was the major LSP1 transcript in three of four Mb or Mt samples and NM_001013253 was the major transcript in the fourth sample (Table S1); however, the multiplicity of LSP1 isoforms complicates their resolution (see text). (d) Examples of RRBS data tracks for several of the myogenic progenitor cell, lymphoblastoid cell, and skin fibroblast samples.

