
Figure 3.
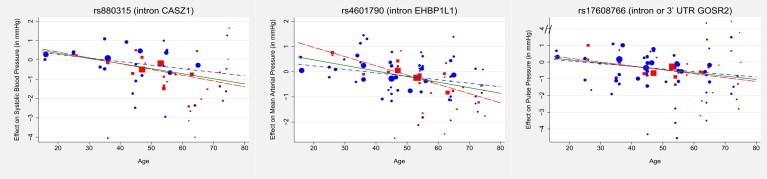
CASZ1, EHBP1L1, GOSR2, the Three Loci Exhibiting the Largest SNP-Age Interactions during the Combined Metaregression of Stage 1 and Stage 2 Subgroups
The figures display the SNP effect as a function of age. Study- and age bin-specific genetic effects from stage 1 and stage 2 are represented by red squares and blue circles, respectively, with the symbol size proportional to the inverse variance of the SNP main effect. The corresponding stage 1, stage 2, and combined consortia metaregressions are represented by red long-dashed, blue dashed-dotted, and green solid lines, respectively. The coded alleles of all three index SNPs are associated with increased blood pressure in the young but reduced blood pressure in the elderly.