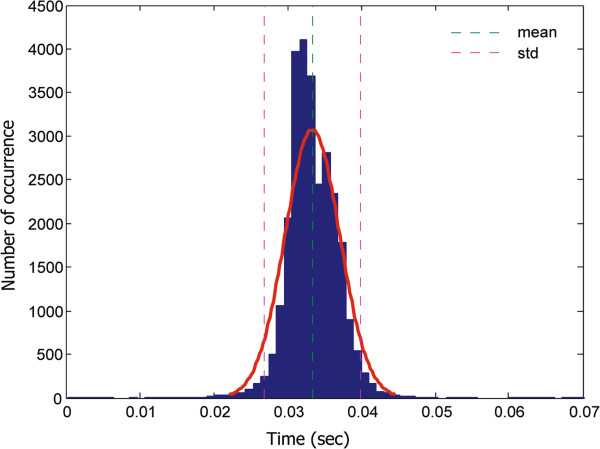
Figure 9.

Histogram of the timestamp difference for motion samples collected by the Kinect camera. The histogram shows the statistical analysis of the time difference for motion samples collected by the Kinect camera. The mean sampling time was 0.0334 sec (sampling frequency of 29.94 Hz), while the sampling error is ± 0.0037 sec; this implies a sampling frequency error of 2.7 Hz. A Gaussian curve (red color) has been fitted on the data.
