Figure 2.
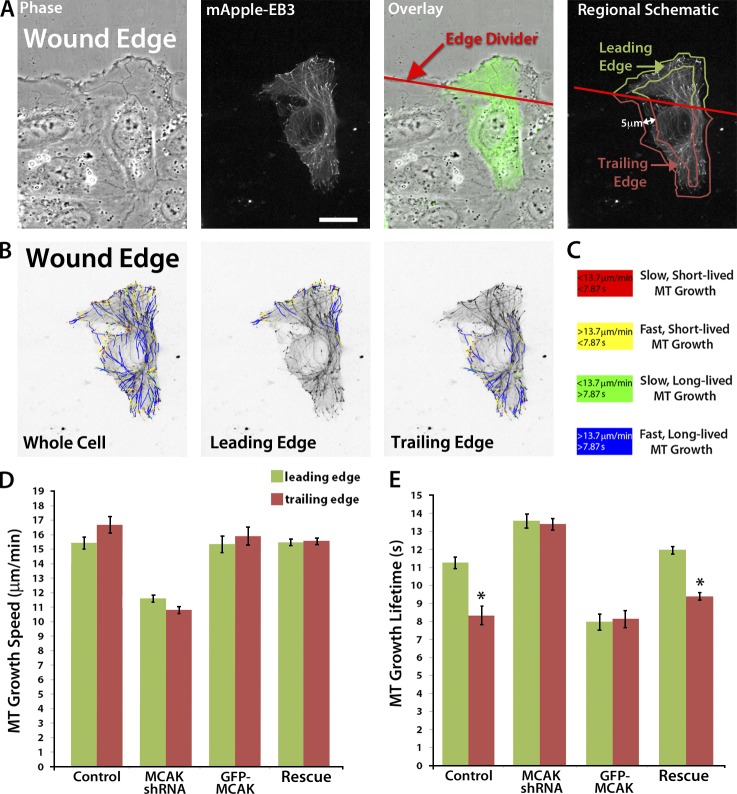
MCAK limits MT growth in the trailing edge of migrating cells. (A) Phase-contrast, mApple-EB3, overlay (EB3 shown in green), and schematic depicting the methodology used for defining the leading and trailing edge regions of HUVECs at the edge of a monolayer wound. The line labeled “edge divider” was placed along the edge of the wound to maximize its intersection with distal-most cell–cell junctions as determined from a larger field-of-view image. The edge of the wound faces up. (B) Example of overlays of MT growth tracks from 2-min time-lapse videos of mApple-EB3 (2-s intervals) from plusTipTracker software of tracks for the whole cell and subpopulations of tracks from the leading or trailing edge regions of the cell depicted in A. (C) MT growth tracks in B are color coded according to their growth speed and lifetime. (D and E), Comparison of mean MT growth speeds (D) and mean MT growth excursion lifetimes (E) within the leading and trailing edges of wound-edge HUVECs. Bar, 10 µm. *, P < 0.001. Error bars show ± standard error.

