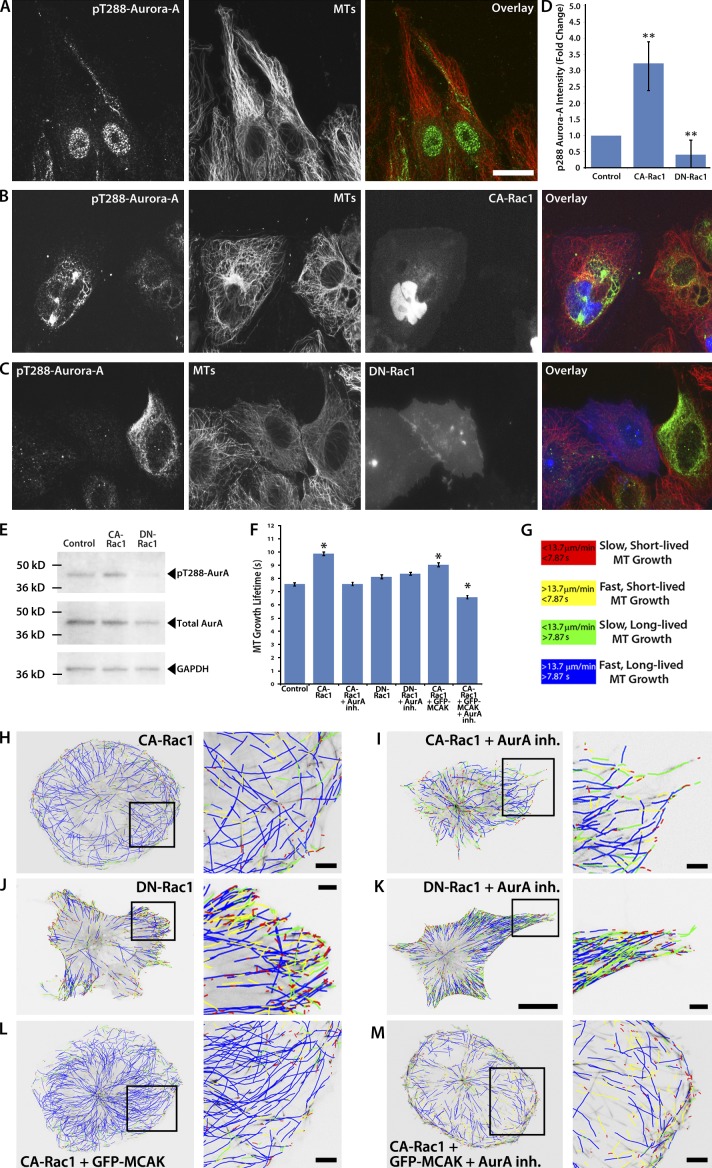
Figure 6.
Aurora A regulates MT dynamics in response to Rac1 activity. (A–C) Immunolocalization of pT288–Aurora A and MTs in untransfected control HUVECs (A) or HUVECs expressing BFP-tagged CA-Rac1 (B) or DN-Rac1 (C) at the edge of a monolayer wound. The wound edge faces up. (D) Quantification of fluorescence intensity measurements of pT288–Aurora A in wound-edge HUVECs under the conditions described in A–C. (E) Western blot for pT288–Aurora A in lysates of untransfected control HUVECs (control) or HUVECs expressing CA-Rac1 or DN-Rac1. Lysates were also probed for total Aurora A, and GAPDH is shown as a loading control. (F) Comparison of mean MT growth lifetimes measured from 2-min time-lapse videos of mApple-EB3 using plusTipTracker software in HUVECs expressing mApple-EB3 (control) or HUVECs coexpressing mApple-EB3 and CA-Rac1 or DN-Rac1 in the presence or absence of 40 nM Aurora A inhibitor, or coexpressing mApple-EB3 and CA-Rac1 or DN-Rac1 and GFP-MCAK in the presence or absence of 40 nM Aurora A inhibitor. (G–M) MTs are color coded according to their growth speed and lifetime (color scheme in G). (H–M) MT growth tracks from 2-min time-lapse videos of mApple-EB3 (2-s intervals) overlaid on images of whole HUVECs (left) and zoom of black-boxed regions (right) of HUVECs, treated as described. Bars: (main) 10 µm; (zoomed) 2 µm. *, P < 0.001; **, P < 0.05. Error bars show ± standard error in F and ± standard deviation in D.

