Figure 7.
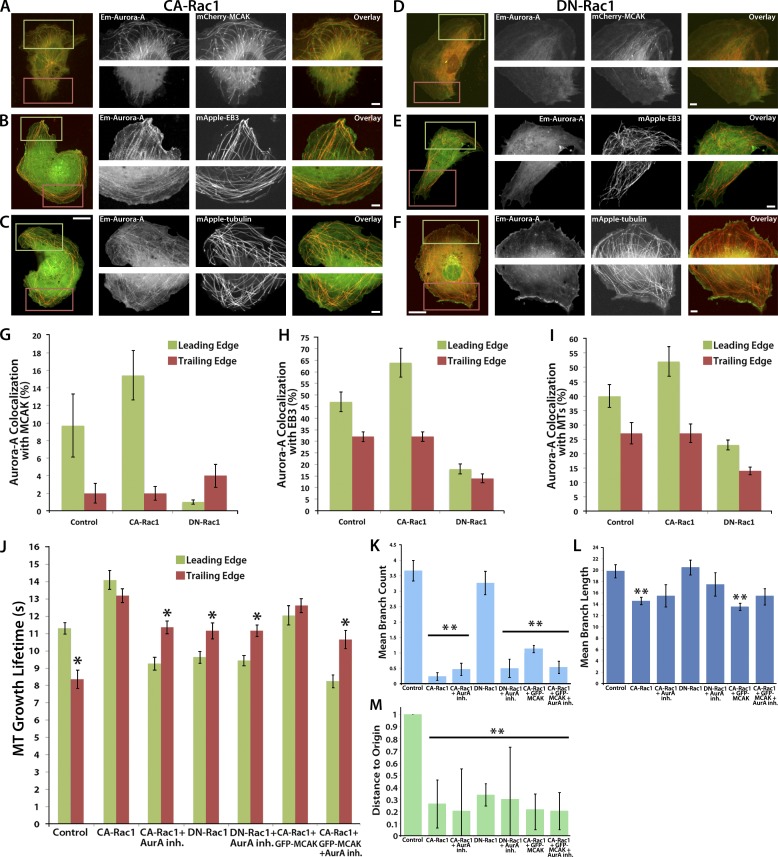
Rac1 promotes long-lived leading edge MT growth excursions in an Aurora A– and MCAK-dependent manner. (A–F) Images showing the whole cell (left) and zoomed regions of the leading (green boxes and top right row) and trailing (red boxes and bottom right row) edges of HUVECs at the edge of a monolayer wound that were coexpressing either CA-Rac1 (A–C) or DN-Rac1 (D–F) together with Em–Aurora A and either mCherry-MCAK (A and D), mApple-EB3 (B and E), or mApple-tubulin (C and F; see also Videos 3 and 4). The wound edge faces up. (G–I) Quantification and comparison of the fraction of Em–Aurora A that colocalized with MCAK (G), EB3 (H), or tubulin (I) in control, CA-Rac1, or DN-Rac1–expressing HUVECs. (J) Comparison of mean MT growth lifetimes measured from 2-min time-lapse videos of mApple-EB3 using plusTipTracker software in the leading and trailing edges of wound-edge HUVECs expressing mApple-EB3 (control) or HUVECs coexpressing mApple-EB3 and CA-Rac1 or DN-Rac1 in the presence or absence of 40 nM Aurora A inhibitor, or coexpressing mApple-EB3 and CA-Rac1 or DN-Rac1 and GFP-MCAK in the presence or absence of 40 nM Aurora A inhibitor. Quantification of branch number (K) and length (L) in HUVECs cultured on fibronectin-coupled 0.7-kPa polyacrylamide substrates to promote branching morphologies. (M) Quantification of directional HUVEC migration in wound-edge migration assay. Bars: (main) 10 µm; (zoomed) 2 µm. *, P < 0.001; **, P < 0.05. Error bars show ± standard deviation in G–I and K–M and ± standard error in J.

