Figure 1.
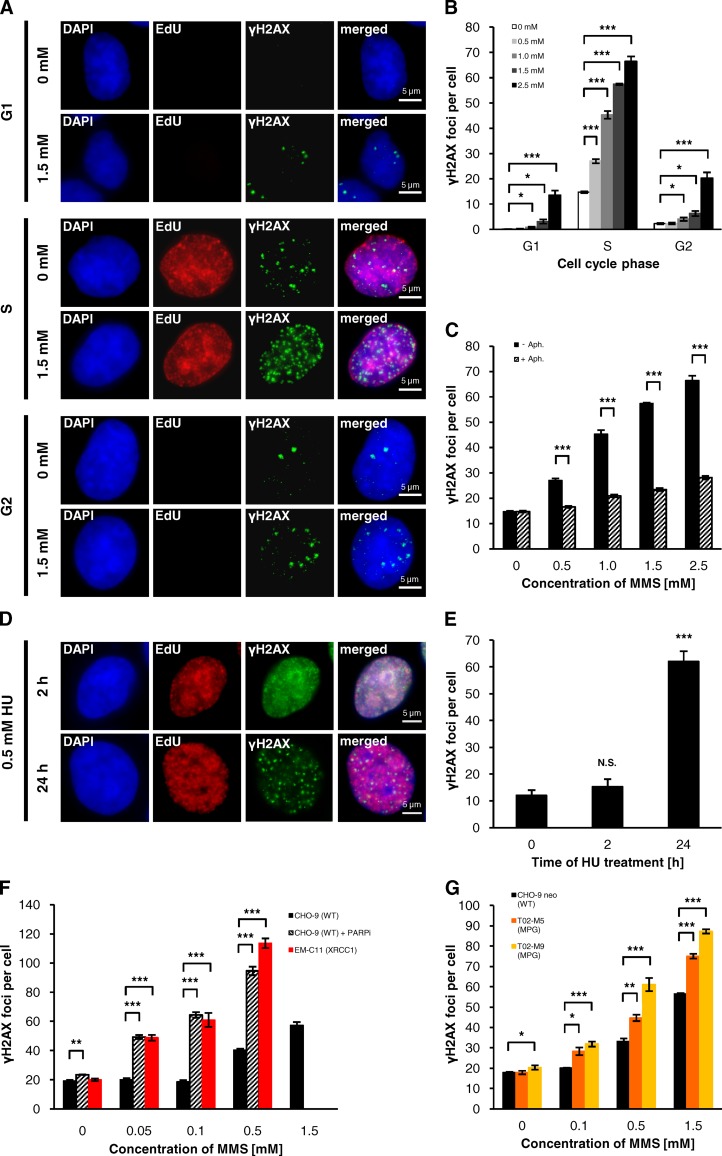
Disrupted repair of MMS-induced base damage leads to DSBs in S phase. (A and B) γH2AX foci in MMS-treated A549 cells. Cells were treated with 10 µM EdU and different concentrations of MMS for 1 h. 15 min after removing EdU/MMS, cells were fixed and stained against γH2AX and EdU. γH2AX foci were assessed in EdU-positive S-phase cells and EdU-negative G1- and G2-phase cells (B, ±SEM from three experiments); G1- and G2-phase cells were distinguished by quantifying the DAPI signal using the Metafer Scanning System (Metasystems). Representative images for cells treated with 0 or 1.5 mM MMS are shown in A. (C) γH2AX foci under replication-inhibiting conditions. After EdU labeling for 1 h, A549 cells were treated with 1 µM aphidicolin (Aph.) for 1 h before MMS was added for an additional hour. 15 min after removing MMS, cells were fixed and stained against γH2AX and EdU. γH2AX foci were assessed in EdU-positive S-phase cells (±SEM from three experiments). (D and E) γH2AX foci in HU-treated A549 cells. After labeling with 10 µM EdU for 1 h, cells were treated with 0.5 mM HU for the indicated times, fixed, and stained against γH2AX and EdU. γH2AX foci were assessed in EdU-positive S-phase cells (E, ±SEM from at least three experiments). For statistical analysis, γH2AX foci after HU treatment were compared with the untreated control. Representative images of the γH2AX signals after 2 and 24 h of HU treatment are shown in D. (F) γH2AX foci in CHO-9 WT cells treated with a specific PARP inhibitor (PARPi) and in XRCC1-deficient EM-C11 cells. Cells were treated with 10 µM EdU and different concentrations of MMS for 1 h. 15 min after removing EdU/MMS, cells were fixed and stained against γH2AX and EdU. Where indicated, cells were treated with 15 µM PARPi 1 h before EdU and MMS were added and PARPi was present until fixation. γH2AX foci were assessed in EdU-positive S-phase cells (±SEM from 3–4 experiments). In CHO-9 cells with PARPi and in EM-C11 cells, γH2AX foci numbers after 1.5 mM MMS were too high for exact enumeration. (G) γH2AX foci in CHO-9 neo (WT) and two MPG-overexpressing cell lines (T02-M5 and T02-M9) that show a twofold or 12-fold elevated MPG activity compared with WT cells. Cells were treated and analyzed as in F (±SEM from three experiments). *, P < 0.05; **, P < 0.01; ***, P < 0.001.

