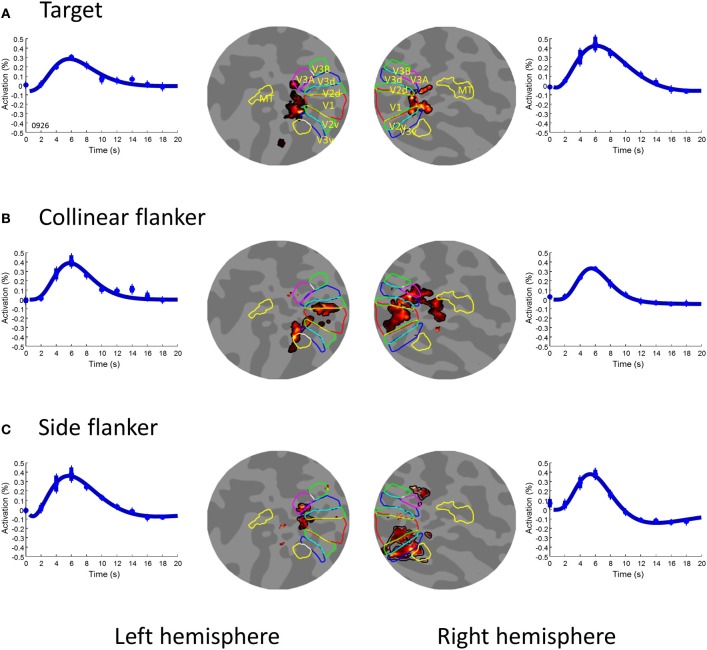
Figure 2.
The first order activation for the three image components. (A) the target, (B) the collinear flanker, and (C) the side flanker. In each row, the two inner insets illustrated voxels (pseudo-colored area) showing significant [t(253) > 4.72] activation to the respective image component on a flat map in the left and right hemispheres respectively. The colored contours denote visual areas as labeled in Panel (A). The outer insets of each row are the waveform of activation averaged across significant voxels in the left and right hemispheres respectively. The smooth curve is the fit of a difference-of-gamma function. The error bars denote one standard error of measurement.

