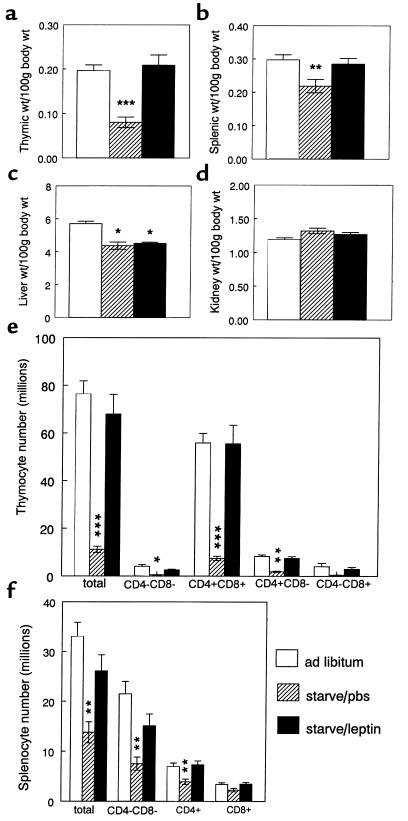
Figure 1.
The effect of leptin administration during starvation on lymphoid (a, b, e, and f) and nonlymphoid tissues (c and d) in C57BL/6 mice. (a) Thymic weight, (b) splenic weight, (c) liver weight, (d) kidney weight, (e) thymocyte subpopulations, and (f) splenic subpopulations. Values represent mean ± SEM. *P < 0.05 vs. ad libitum–fed controls; **P < 0.05, ***P < 0.0001 PBS-treated starved mice vs. both ad libitum–fed controls and leptin-treated starved mice.

