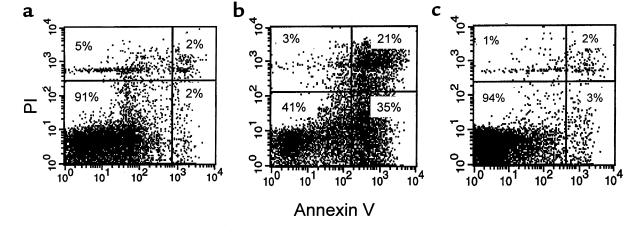
Figure 5.
Representative flow-cytometric analyses of thymocytes stained with annexin V and PI. (a) Wild-type mice. (b) Ad libitum–fed ob/ob mice. (c) Leptin-treated ob/ob mice. Shown are live thymocytes (lower-left quadrant), thymocytes in the early stages of apoptosis (lower-right quadrant), thymocytes in the late stages of apoptosis (upper-right quadrant), and dead thymocytes (upper-left quadrant).

