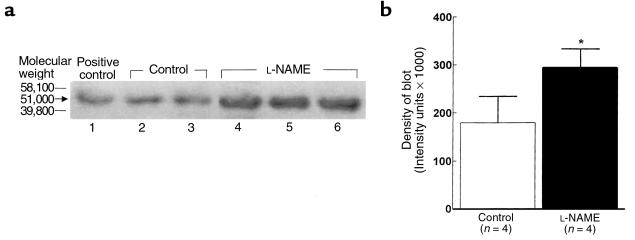
Figure 4.
(a) Representative Western blot showing the expression of CYP4A protein (51 kDa mol wt) in renal microsomes prepared from normal rats (control, lanes 2 and 3) or in those treated with L-NAME (lanes 4, 5, and 6). Samples of liver microsomes treated with clofibrate provided the positive control (lane 1). The immunoblotting procedure used anti-rat CYP4A primary antibody from sheep. (b) Density of the blot as analyzed by densitometric scanning. *P < 0.05, L-NAME (n = 4) vs. control (n = 4).

