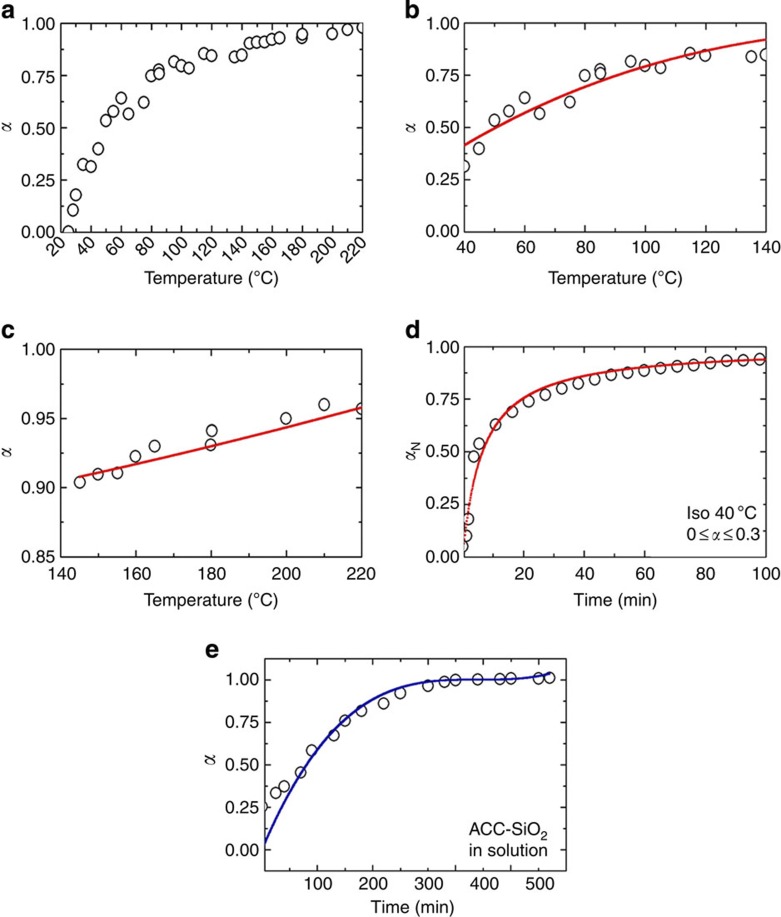
Figure 6. Analysis of the progress of dehydration.
Dehydration curves of ACC and ACC-SiO2 particles as a function of temperature (T) or time (t), together with best fits to the common solid-state reaction models described in Table 1. (a) Dehydration of uncoated ACC on heating in air is shown over the range 20–220 °C. Panels b and c show specific ranges of this dehydration process where b shows the range 40–140 °C, and is fitted by a geometric contraction and c shows the range 140–220 °C, which is fitted by a second-order nucleation model. Panel d shows the dehydration of the same sample under isothermal annealing at 40 °C. (e) Dehydration as a function of time for ACC-SiO2 particles on incubation in solution at 25 °C. α is the total fraction of water (as in Fig. 5), while αN refers only to the fraction of water lost over each particular range (from 0 at the start to 1 at the end).

