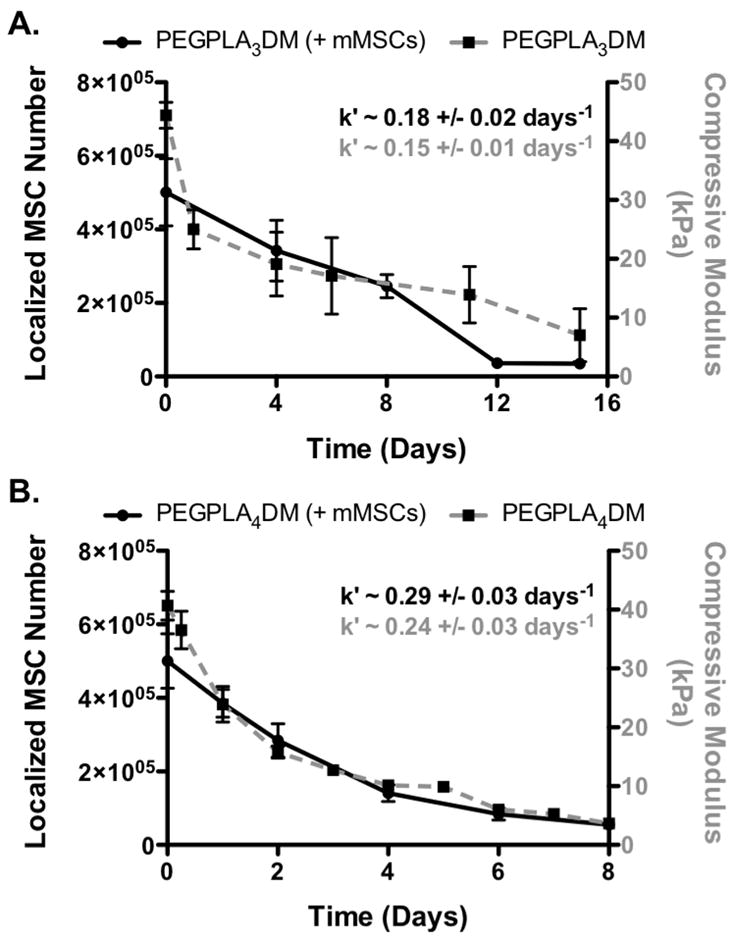
Figure 6.

GFP+ mMSC in vivo localization to the allograft surface (black solid lines) was found to be in agreement with in vitro hydrogel degradation kinetics (grey dashed lines); PEGPLA3DM (A) and PEGPLA4DM (B) (n=5–6; error bars represent standard deviation; no statistical difference was found between k′-values for any experimental groups).
