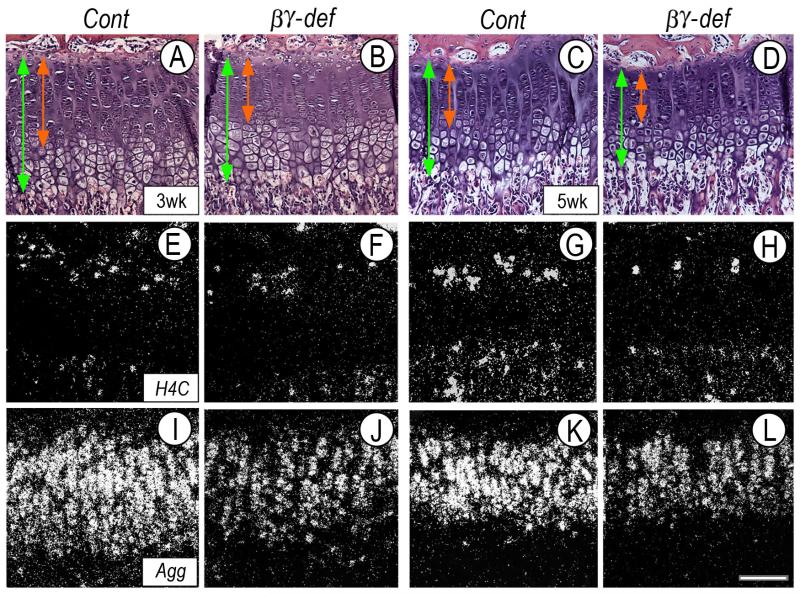
Fig. 3.
Analyses of growth plate organization, chondrocyte proliferation and aggrecan expression.
(A-L) Serial sections from proximal tibial growth plates of 3 week-old (A-B, E-F and I-J) or 5 week-old (C-D, G-H and K-L) control and RARβ/RARγ-deficient littermates were processed for histological analysis (A-D) and in situ hybridization for proliferation marker H4C (E-H) or aggrecan (Agg) (I-L). Note the reduction of mutant growth plate height (vertical green line) mostly affecting upper zones (red line), and more obvious in 5 week-old mice. Size bar, 75 μm.

