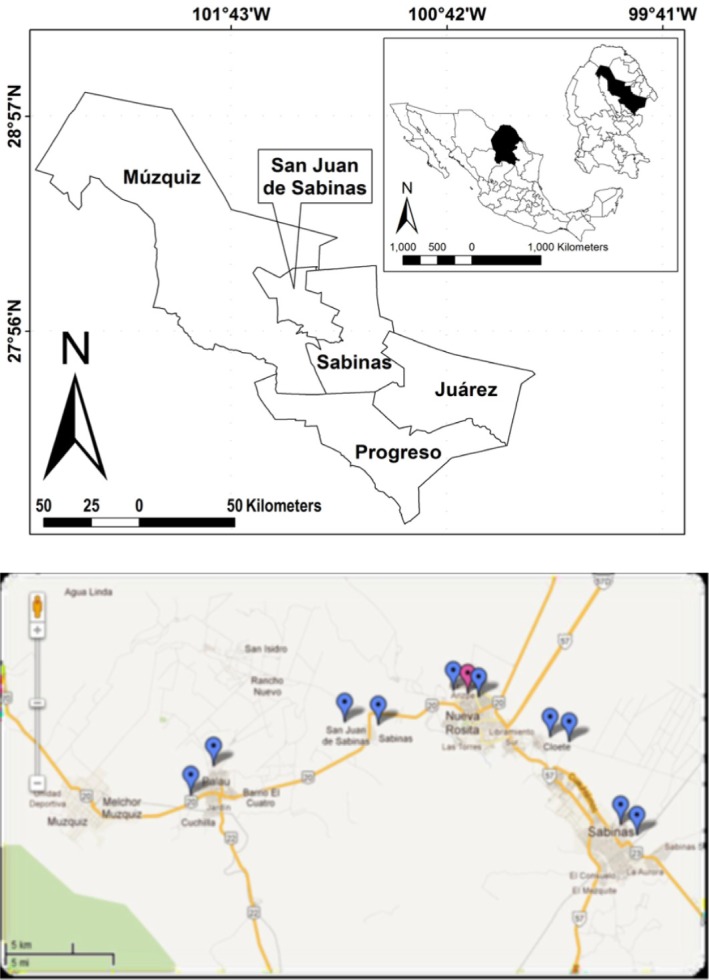
Fig. 1. Above, a map showing the five municipalities that comprised the coal mining regions in the state of Coahuila. The insert in the upper right corner, represents (black filled shapes) the location of the state of Coahuila in Mexico, as well as the proportion of the coal mining regions in the state of Coahuila. Below, geographical location of Chagas disease cases in the coal mining region of Coahuila in the period January to June 2011. The image was taken from Google Earth®. The blue balloons correspond to the location of the cases. The red balloon represents a positive case found during the epidemiological study.

