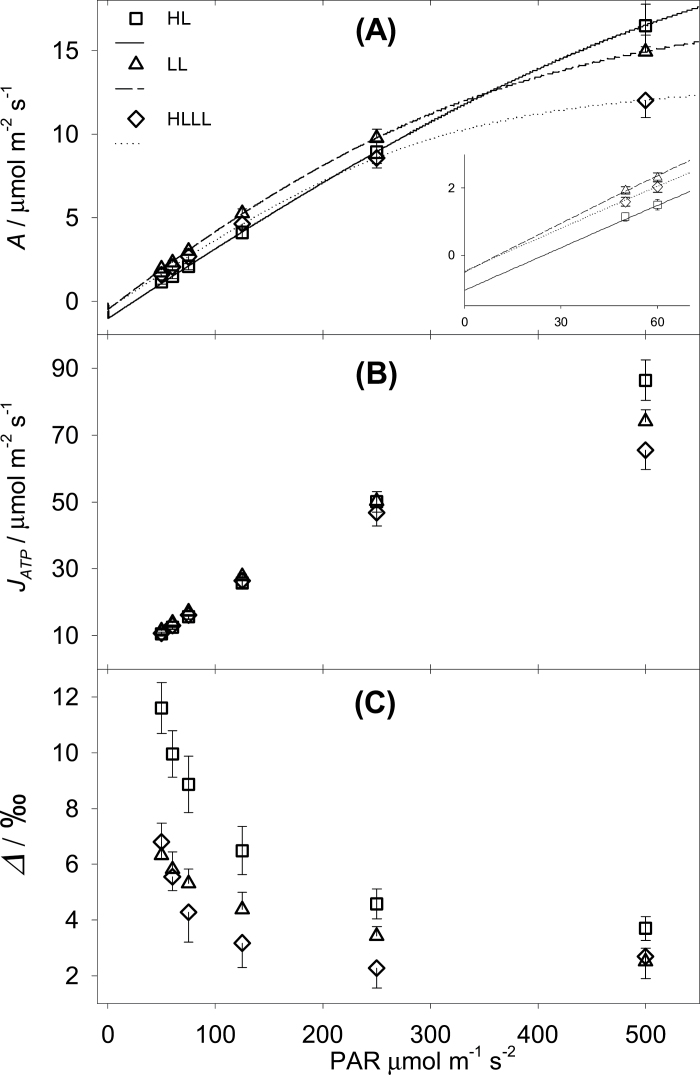
Fig. 1.
Maize responses to decreasing light intensities for plants grown under high light (HL), low light (LL) or LL following HL (HLLL). (A) Net assimilation (A). The curves were fitted to calculate the LCP (Table 2). The inset shows a magnification at the lowest PAR. (B) Total ATP production rate (J ATP), measured with the low O2-ETR method (see Materials and methods section on gas exchange measurements). (C) Online isotopic discrimination during photosynthesis (Δ). Error bars represent one SE (n = 6).

