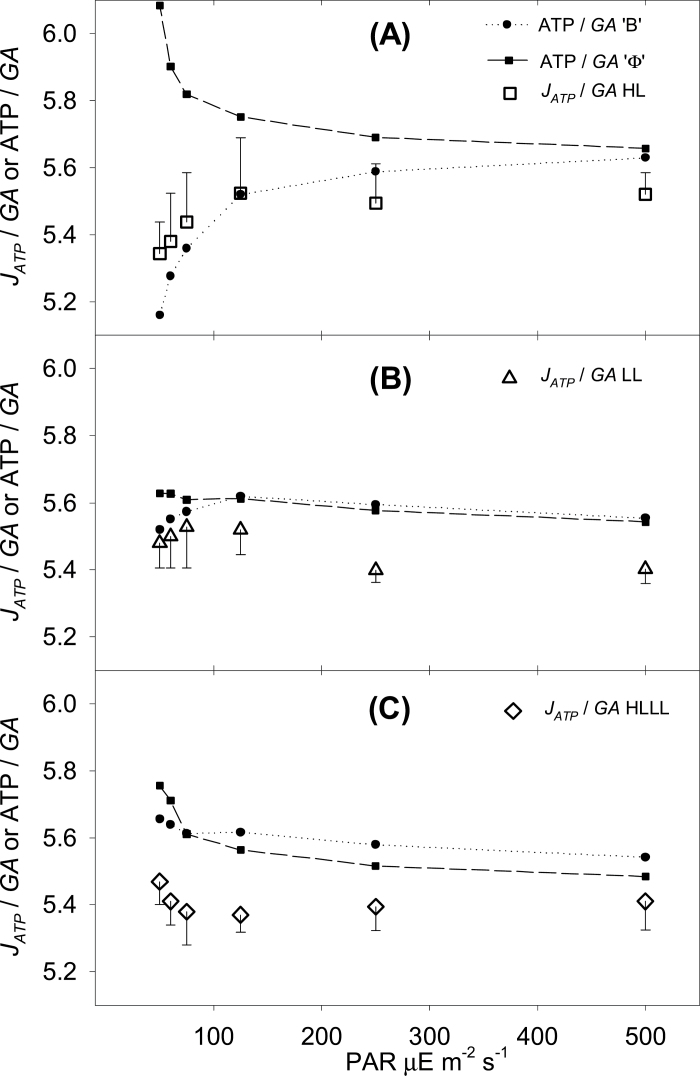
Fig. 5.
ATP cost of gross assimilation, representing C4 biochemical operating efficiency for HL plants (A), LL plants (B), and HLLL plants (C). The empirical values for J ATP/GA (empty symbols) were compared to predicted values for ATP/GA (solid symbols) calculated with two different approaches. ATP/GA was calculated using ϕ as the sole proxy for operating efficiency (ϕ approach; solid squares) or using a comprehensive calculation summing the ATP cost of all processes contributing to assimilation (B approach; solid circles). Note that both calculations were based on the same dataset, presented in Figs 1–3 and Table 2. Error bars represent one SE; n = 6 plants per condition.

