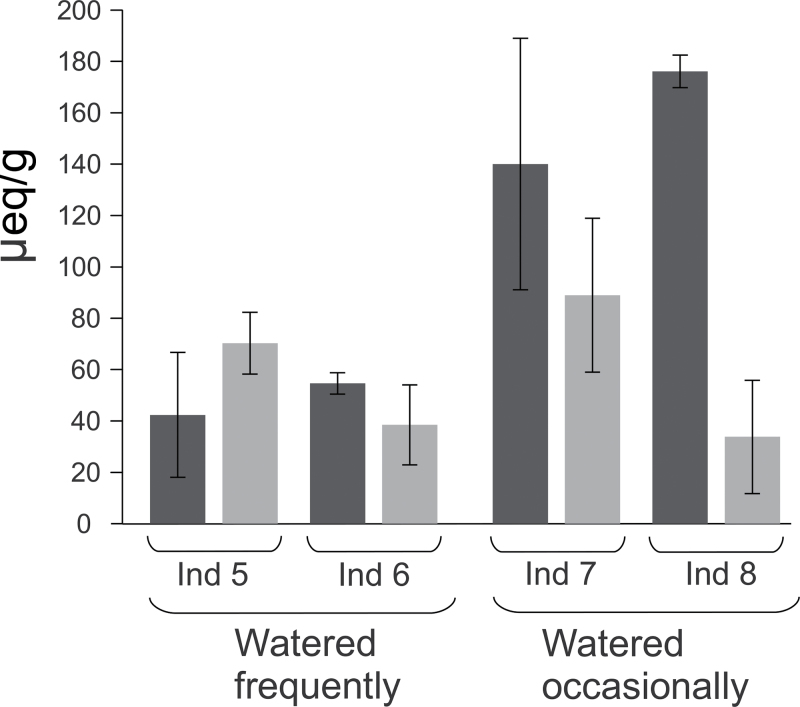
Fig. 2.
Effect of the water regime on titratable acidity. The titratable acidity (in microequivalents per gram of frozen weight, μeq/g) is indicated for samples taken at the end of the dark phase (dark grey) and at the end of the light phase (light grey). The error bars indicate standard deviations over three replicates.

