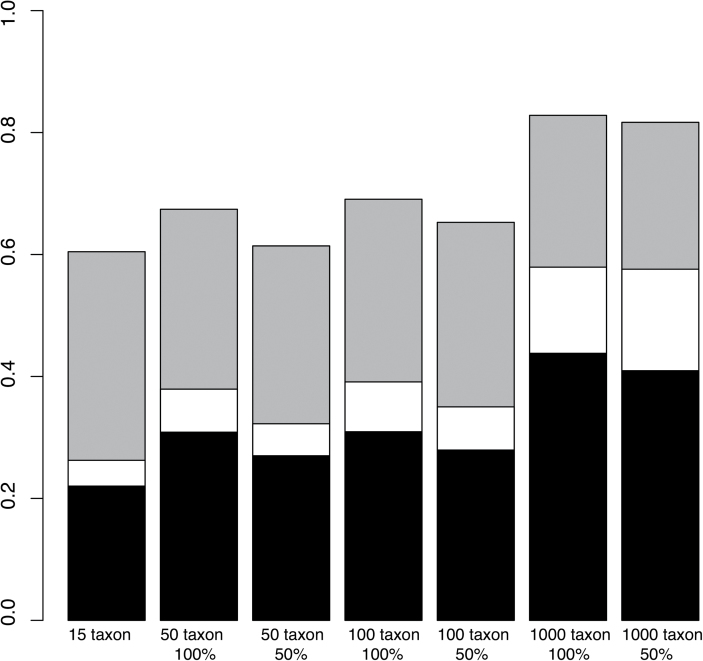
Fig. 3.
Probability of accurately inferring an ordered trajectory when the generating data is ordered for each taxon group at the three predefined thresholds, in order of decreasing stringency: (1) cells B, C, and F must be 0 (black); (2) cells B, C, and F must be less than 0.1 (white); (3) cells B, C, and F have rates at least one magnitude less than the average transition rate of cells A, E, and I (grey). The probability of inferring the correct evolutionary model increases with 1) taxon sample size and 2) loosening threshold stringency.

