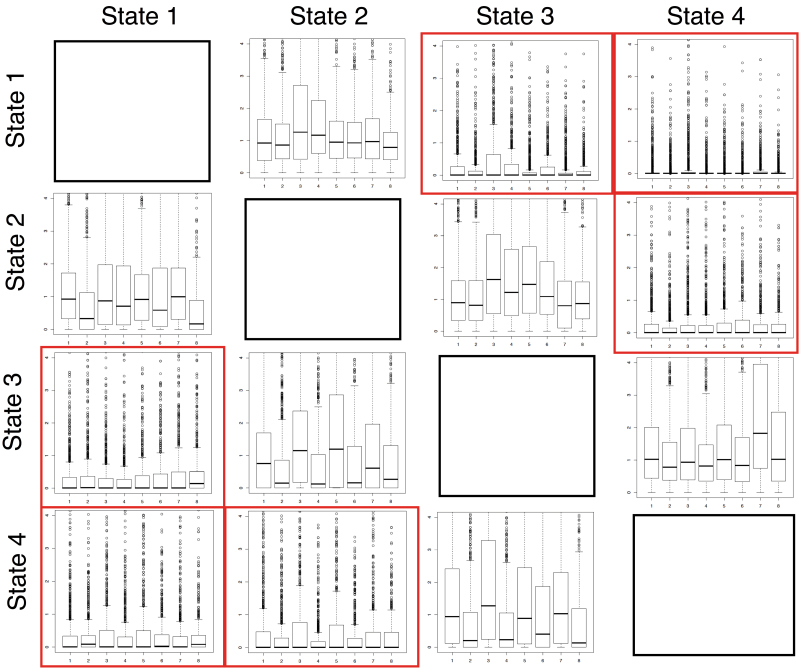
Fig. 5.
Four-by-four Q matrix represents the transition rates between character states 1–4 for the fully sampled 1000-taxon ordered data set. Box plots within each cell represent the generated transition rates for each of the eight simulating Q matrices. Forward and reverse ‘zero cells’ (not allowed to evolve under an ordered model) are outlined. Transition rates are consistently lower within the ‘zero’ cells and especially between state 1 and state 4 (this figure is available in colour at JXB online).

