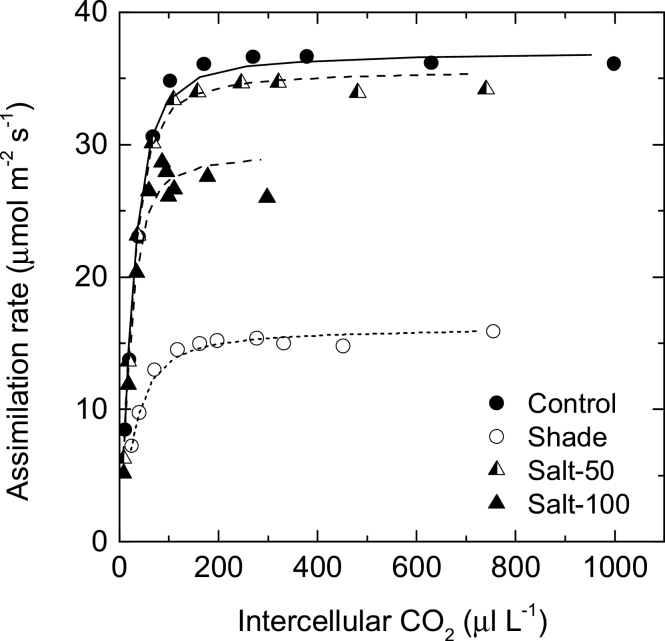
Fig. 3.
A/C i response curves for leaves of maize exposed to salinity and shade. Responses of assimilation rates to intercellular CO2 (A/C i curves) measured at a light intensity of 1800 µmol m–2 s–1 and a leaf temperature of 26 °C. Data points are the average of two replicates. Lines are the mathematical fits using the C4 photosynthesis model (von Caemmerer, 2000). Maize plants were grown in full sunlight and irrigated with water (control, filled circle), 50mM NaCl (Salt-50, half-filled triangle), or 100mM NaCl (Salt-100, filled triangle), or grown in 20% sunlight (shade, open circle).

