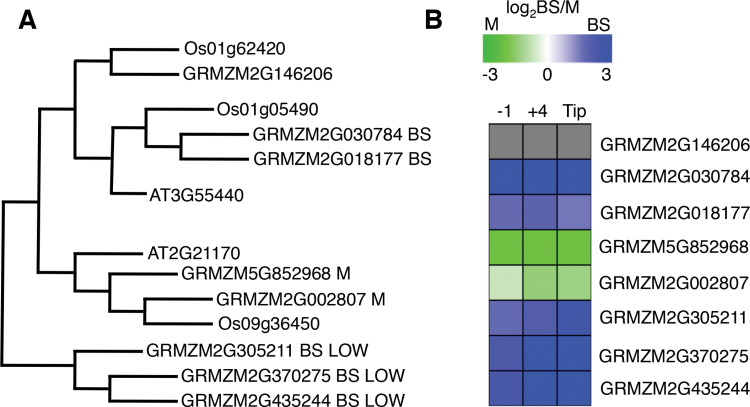
Fig. 3.
TIM family members assigned to BS or M. (A) TIM family putative orthologue group, POG, represented by phenetic tree generated from protein MUSCLE alignment and using UPGMA (unweighted pair group method and arithmetic mean) (Edgar, 2004; Tomcal et al., 2013). Members with similar cell-biased expression cluster together. (B) DE heat map of TIM genes. Grey boxes for the cytosolic form of TIM represent no DE data. Green signifies an M-biased ratio and blue represents a BS-biased ratio based on the log2-transformed BS/M ratio for each section. Detailed expression data is found in Supplementary dataset 2.

