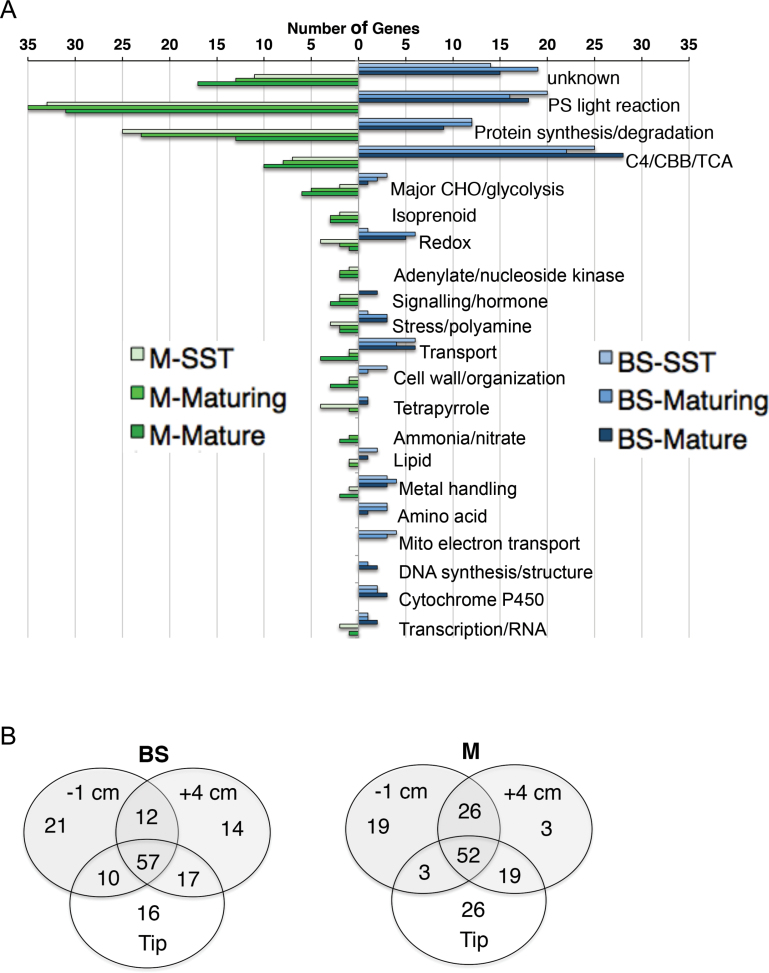
Fig. 4.
Most highly expressed DE genes present throughout blade. (A) The BS or M DE lists were filtered for the top 100 most highly expressed DE genes in each of the three developmental stages. For each section, genes were placed in Mapman categories and plotted by number of members. The categories with the most members were as expected and remained high throughout in both cell types. (B) Venn diagram of genes in the top-100 DE set for each developmental stage. Many genes were found in top-100 of all three stages. The top-100 set of maturing stage shared the most with those of the other two stages. In this set, only 14% of BS genes and 3% of M genes were maturing stage-unique. In contrast, 19% of M genes in SST and 26% of M genes in the mature stage top-100 sets were stage-unique.

