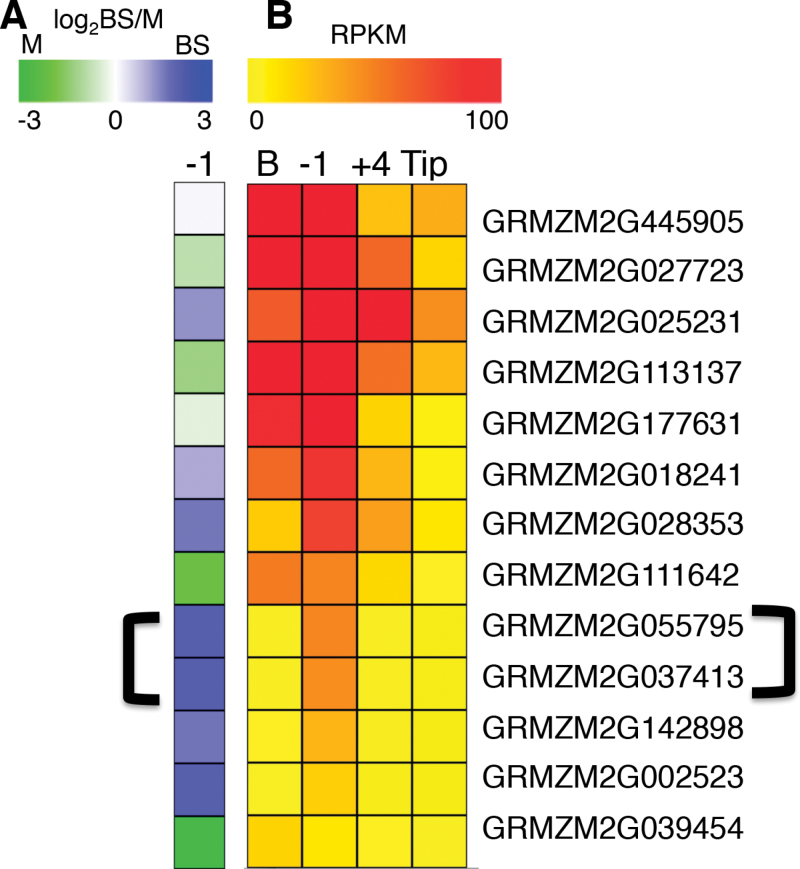
Fig. 6.
Cellulose synthase genes expressed in BS at SST stage. (A) A heat map representing the log2 BS/M ratio for a family of related CesA homologues where blue represents BS and green M. Two BS expressed members indicated by a bracket were found only expressed in the SST stage. (B) Heat map from low (yellow) to high (red) represents the whole section RNA-seq data (Li et al., 2010) for the same genes. Note that the two bracketed BS genes are also only present in the SST stage.

