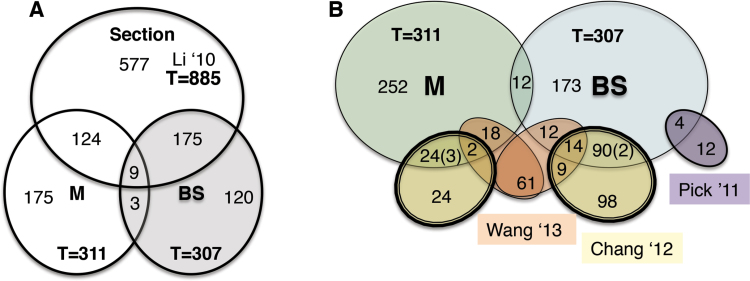
Fig. 7.
Comparing strategies for transcription factor identification. (A) Comparison of BS and M DE-identified TFs with those previously identified from the whole sectional data, after elimination of any genes not found in B73 RefGen_v2 (Li et al., 2010). More BS transcription factors overlap than M. The overlap between the BS and M represents expression patterns that switched DE cell-bias over the developmental gradient. (B) Comparison of BS and M DE-identified transcription factors with other published C4 transcription factor lists. Yellow ovals represent data from Chang et al., 2012; orange ovals represent data from Wang et al., 2013; and purple oval represents data from Pick et al., 2011. In the overlap between the Chang et al., 2012 data and the LM data (this study) the numbers in parenthesis represent expression patterns that changed cell-bias over the developmental gradient and thus were not restricted to the cell type identified by cell separation.

