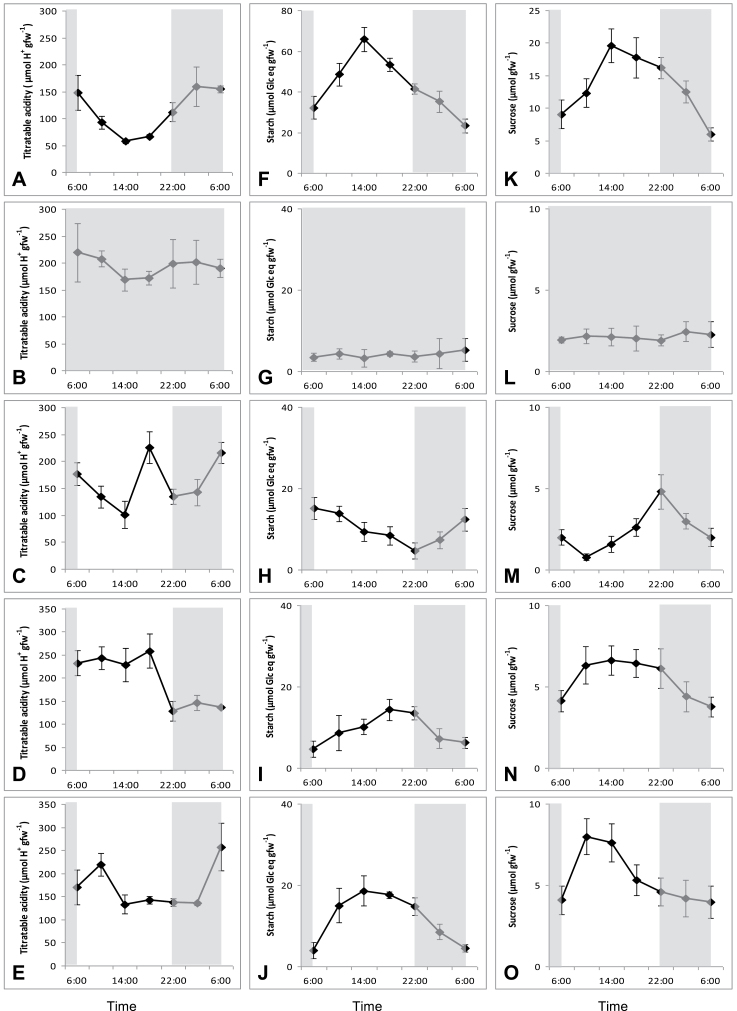
Fig. 3.
Diel patterns of titratable acidity (μmol H+ g–1fw; left panel), starch (μmol Glc eq g–1fw; middle panel) and sucrose (μmol g–1fw; right panel) for young fully developed leaves of Aechmea ‘Maya’ under control light-dark cycle (A, F, K; white light, 100 μmol m–2 s–1), continuous dark (B, G, L), and different monochromatic light-dark cycles (10 μmol m–2 s–1), i.e. blue (C, H, M), green (D, I, N), and red (E, J, O). The dark period is indicated in grey. Data are means±SE (n=5 plants).

