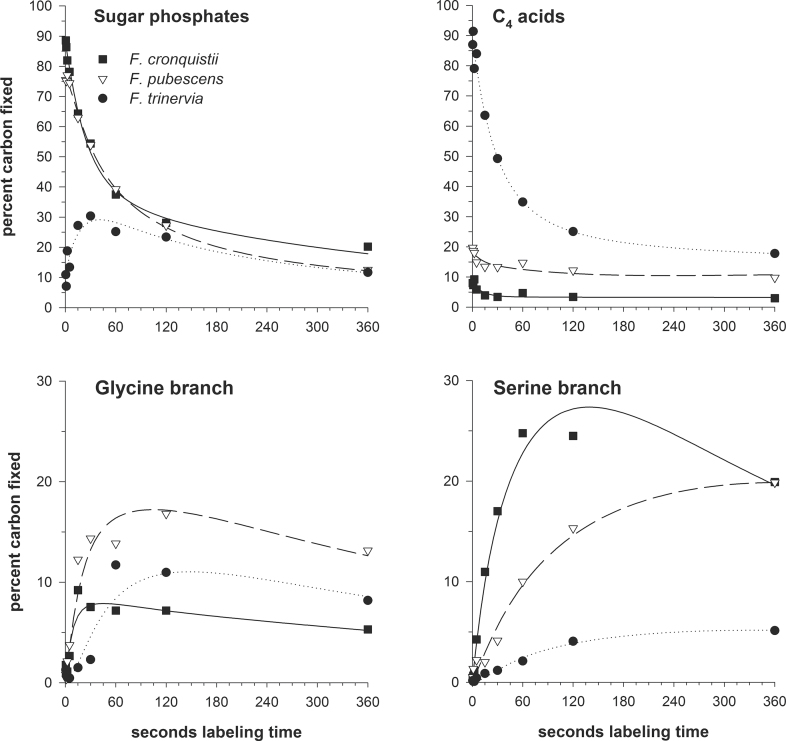
Fig. 2.
Time-courses of CO2 incorporation into sugar phosphates, C4 acids, and intermediates of the two branches of the photorespiratory pathway. Shown are time-courses relative to true photosynthesis, which was set to 100% for easier comparison. Symbols represent mean values from three data points (biological replicates). Solid (F. cronquistii), dashed (F. pubescens), and dotted lines (F. trinervia) are best fits to the labelling functions (Equations 1–4) and were calculated by multi-component non-linear regression analysis.

