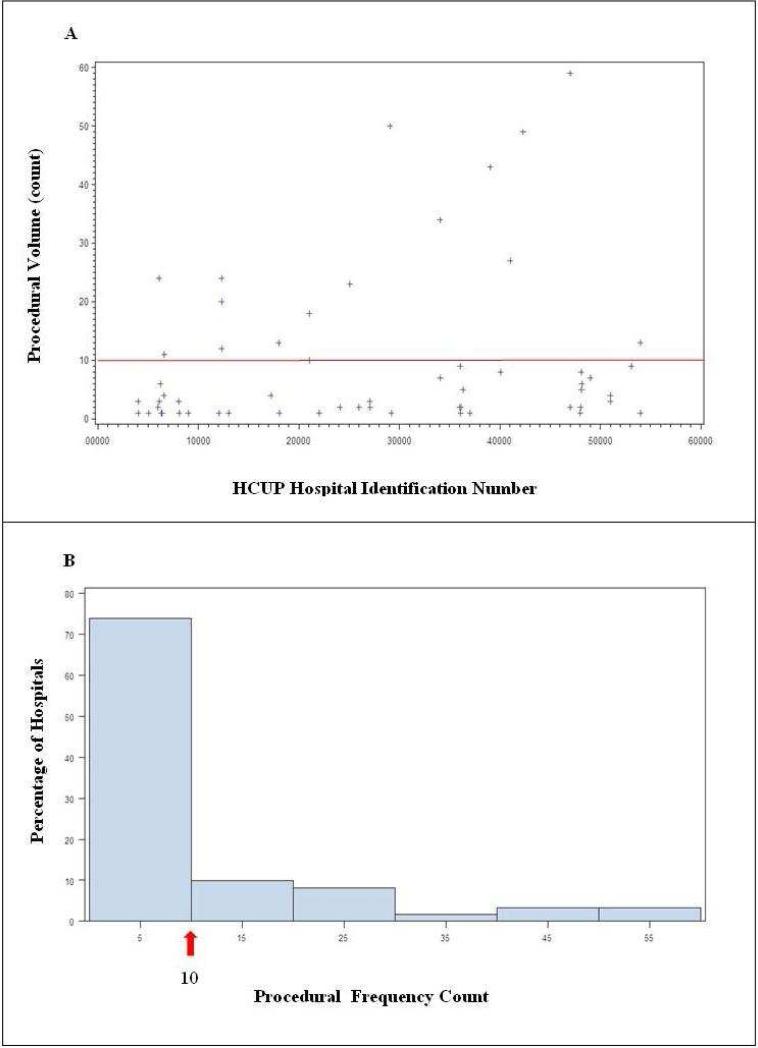
Figure 1.
Procedural volume by hospital. (A) Scatterplot demonstrating frequency of patients treated with endovascular mechanical revascularization at represented hospitals and (B) Histogram demonstrating percentage of hospitals performing mechanical thrombectomy by procedural volume. A natural segregation between centers performing ≥10 procedures (substantial volume) and those performing <10 procedures was derived from scatterplot results. Total substantial volume centers (≥ 10 patients treated/year) 78 (26.4%) and total lower volume centers were 218 (73.6%)

