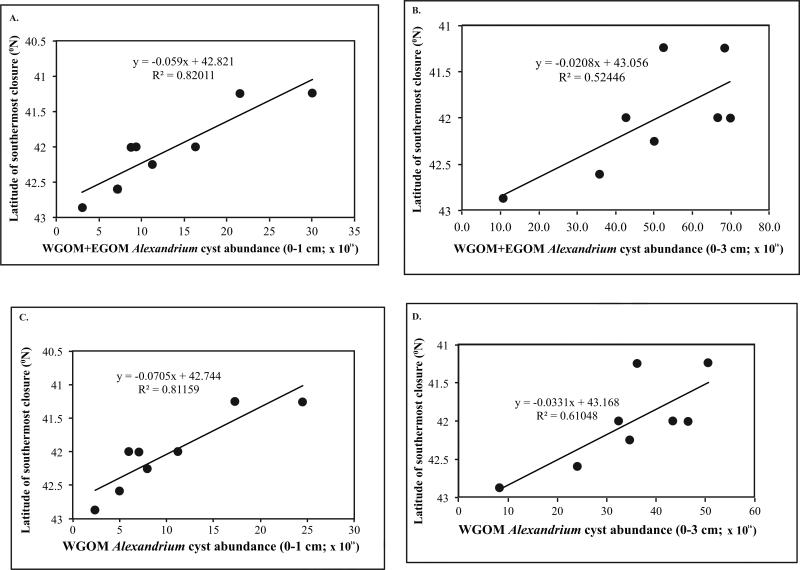
Figure 10.
Relationship between cyst abundance (cysts × 1016) and latitude of the southernmost shellfish harvesting closure due to PSP toxins the following year. (A) WGOM+EGOM cyst abundance (0-1 cm). The relationship is significant (p=0.0020); (B) WGOM+EGOM cyst abundance (0-3 cm). The relationship is significant (p=0.0042); (C) WGOM cyst abundance (0-1 cm). The relationship is significant (p=0.0023); (D) WGOM cyst abundance (0-3 cm). The relationship is significant (p = 0.0042).

