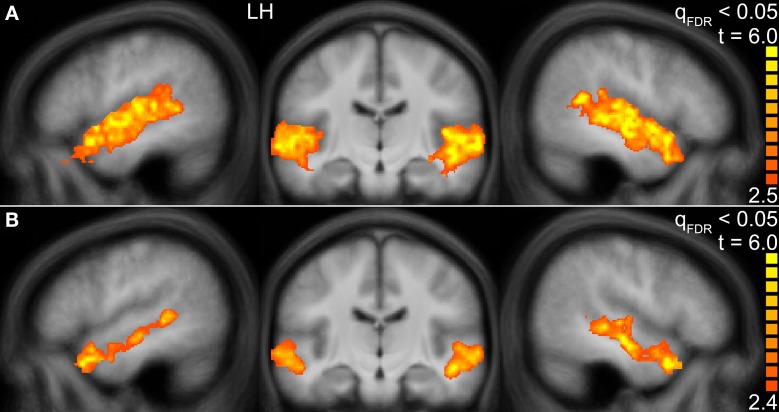
Figure 3.
Group activation maps of the temporal lobes at the FDR corrected significance level of qFDR < 0.05 for the contrasts (A) Human voices > Rest (H+) and (B) Human voices > Animal sounds + Musical instruments (conjunction of H+ and 2H > A + M). The sagittal views are shown in Talairach space at x = −49 (LH, left hemisphere) and x = 47 (right hemisphere), the coronal views at y = −16.

