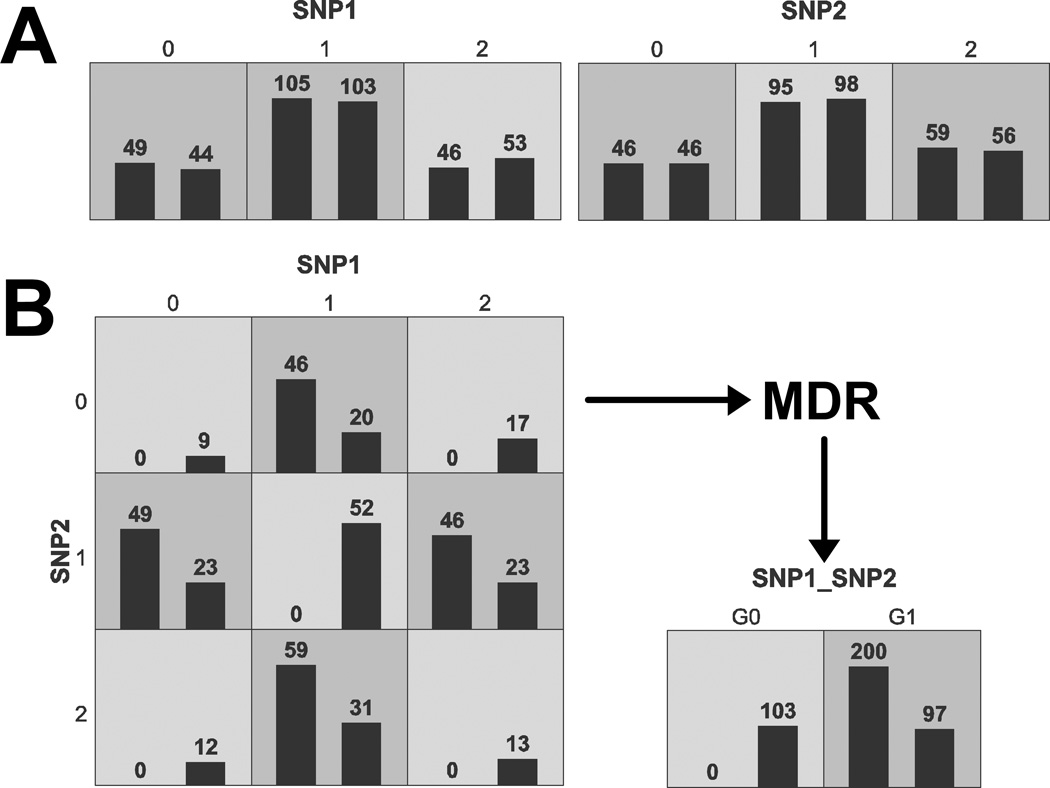
Figure 1.14.1.
(A) Distribution of cases (diseased subjects; left bars) and controls (healthy subjects; right bars) across three genotypes (0, 1, 2) for two simulated interacting single nucleotide polymorphisms (SNPs). Note that the ratio of cases to controls for these two SNPs is nearly identical. The dark shaded cells signify “high-risk” genotypes (empirically determined). (B) Distribution of cases and controls across nine two-locus genotype combinations. Note that considering the two SNPs jointly reveals larger case-control ratios. Also illustrated is the use of the attribute construction function (see Ritchie et al., 2001 for MDR method) that produces a single attribute (SNP1_SNP2 with two levels, G0 and G1) from the two SNPs.

