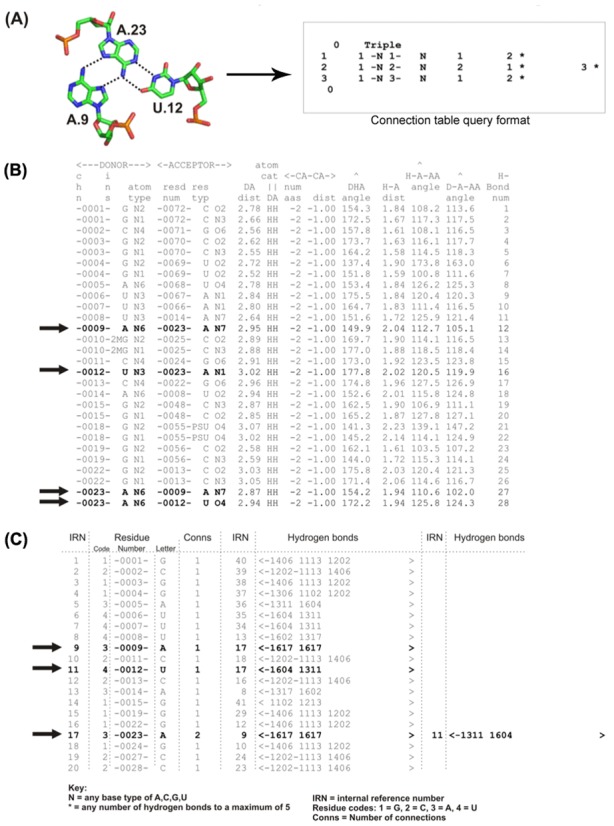
Figure 1.

(A) Base triple interaction example A9.A23.U12 from the yeast tRNAPhe structure (PDB ID: 6tna, left panel) and it's corresponding representation in a connection table (right panel). (B) Partial sample of HBPRED output file with the four hydrogen bonds for the triple in (A) highlighted in bold. (C) Partial sample of the connection table file after conversion from the format in (B) with the interactions for the AAU triple highlighted in bold. The highlighted data in (C) can be read as ‘base A9 (IRN = 9) is connected to one other base, A23 (IRN = 17), by two hydrogen bonds; base U12 (IRN = 11) is connected to one other base, A23, by two H-bonds; base A23 is connected to two other bases A9 and U12 by two hydrogen bonds each’. ‘−1604 1311’ can be read as ‘A23 N6 (1 = nitrogen) donor to U12 O4 (0 = oxygen) acceptor and U12 N3 donor to A23 N1 acceptor’.
