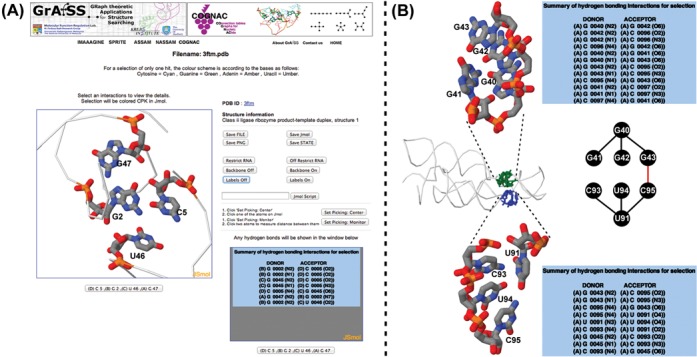
Figure 3.

Examples of COGNAC output: (A) the molecular visualization interface using JSmol (or Jmol) with basic information on the structure, external links to the PDB entry and a listing of the hydrogen bonds involved in the interaction network which in this case is a base quadruple; (B) two matches for a type II quadruple (refer to Figure 2B) search tree query in a lysine riboswitch structure—a GGGG quadruple (center panel, in green) and a CUCU quadruple (center panel, in blue) that upon further scrutiny is interconnected (denoted by red line) to form an octuple base interaction (center panel).
