
Figure 2.
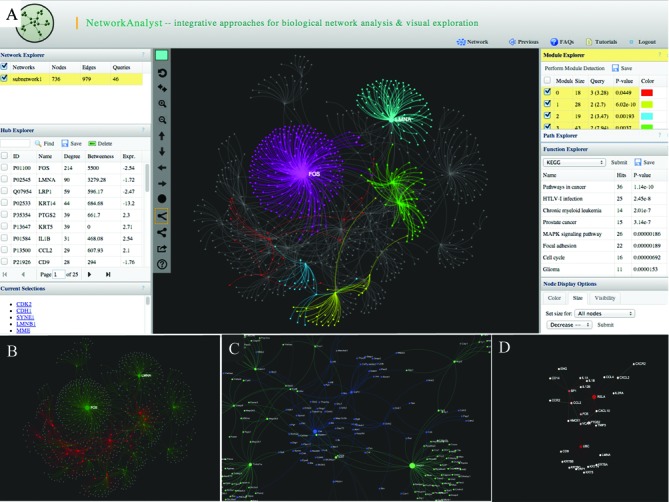
Some screenshots of NetworkAnalyst. (A) The screenshot shows a typical view of network analysis and visualization. The center panel shows the network with multiple modules highlighted in different colors. Several surrounding panels including Network Explorer, Hub Explorer, Module Explorer, Path Explorer and Function Explorer allow users to perform various analyses; (B) an expression view shows the overall expression pattern, with red for up-regulation and green for down-regulation; (C) a zoom-in view shows part of a dense network. Nodes are labeled automatically; (D) a module extracted from a large network using the top 30 nodes with highest degrees.