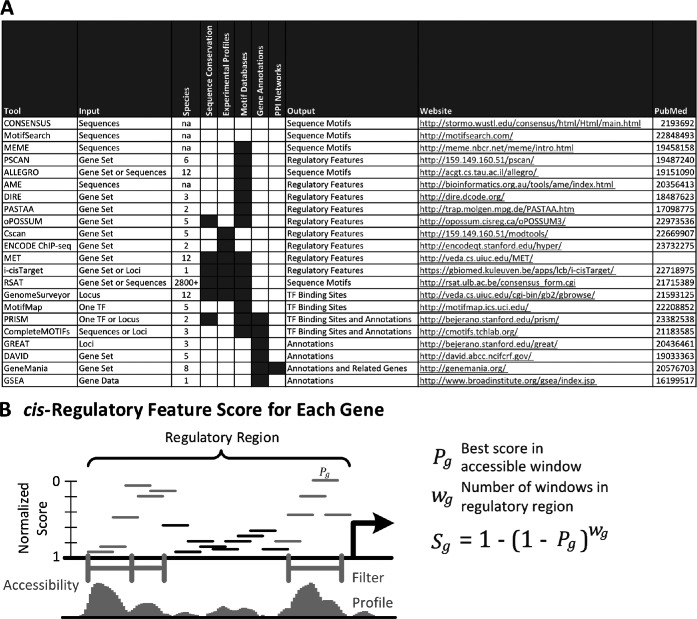
Figure 1.
(A) Comparison of online tools for gene set and cis-regulatory analysis. Each tool is listed along with its typical input and expected output. The grayed cells indicate the types of data sources used by each tool in its analysis. The website URLs and PubMed ID references are also provided. (B) Visualization of calculating a regulatory feature score for a gene. Shown is a particular regulatory region of a gene. The horizontal bars within the regulatory region represent the normalized feature score of each window as calculated by MET for a single TF motif with higher bars representing better scores. Below in gray is a chromatin accessibility profile of the genomic locus and the thick gray bars indicate accessible regions where MET will consider the motif-based scores. The regulatory feature score of the gene for this example TF motif is calculated as shown on the right using the best score in the accessible windows of the regulatory region.

