
Figure 1.
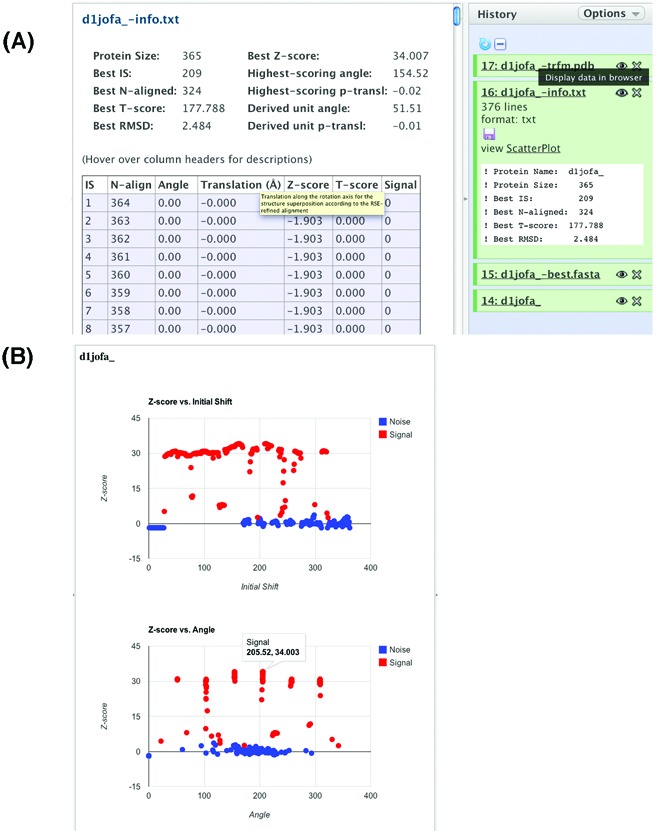
The SymD webserver alignment scan output. (A) Clicking the Eye icon displays the file in the Detail panel. (B) Clicking the ScatterPlot hyperlink displays the Z-score versus Initial Shift and the Z-score versus Angle interactive scatter plots. The six signal peaks in the example plot indicate that the domain has a 7-fold symmetry. Hovering the cursor over a point in the scatter plot displays the x- and y-coordinates of the point.