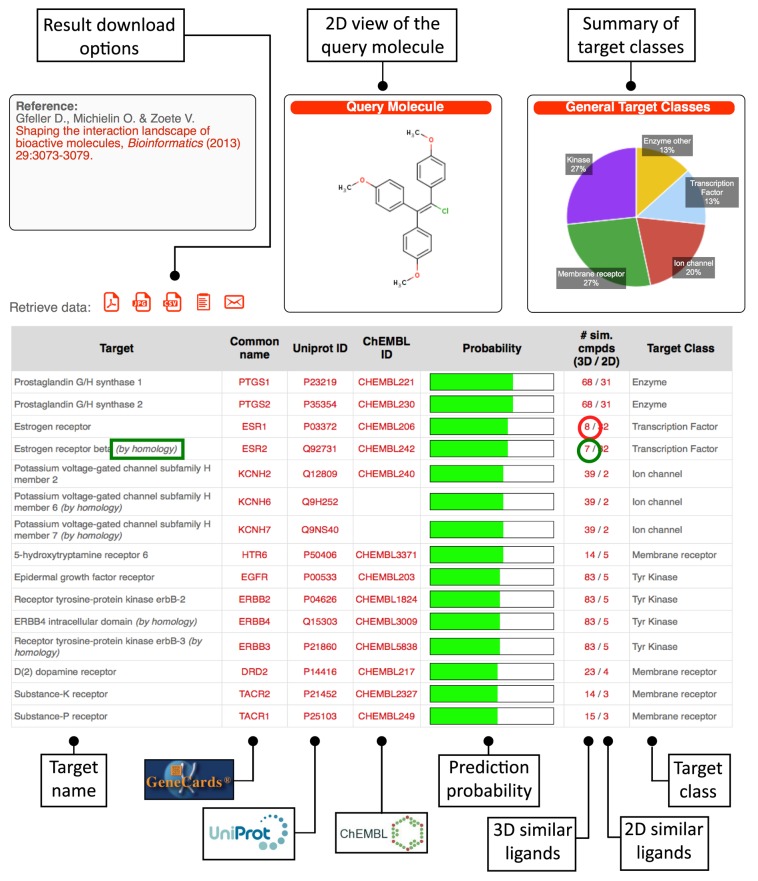
Figure 1.
Prediction result page. This page shows the list of predicted targets for the query molecule (here chlorotrianisene). Targets are ranked according to their scores. Links to GeneCards (under ‘Common name’ column), UniProt and ChEMBL (when available) are provided. Green bars indicate the estimated probability of a protein to be a true target given its score. The sixth column (# sim cmpds 3D/2D) shows the number of ligands of the predicted target or its homologs that display similarity with the query molecule based on either 2D or 3D similarity measures. These numbers are linked to pages containing information about these ligands. For instance, the number circled in red provides a link to the list of ligands of ESR1 or its homologous proteins that display similarity with the query molecule (see Figure 2A). The pie chart shows the distribution of target classes. Predictions based on homology are indicated with ‘(by homology)’ (see the green box).

