
Figure 1.
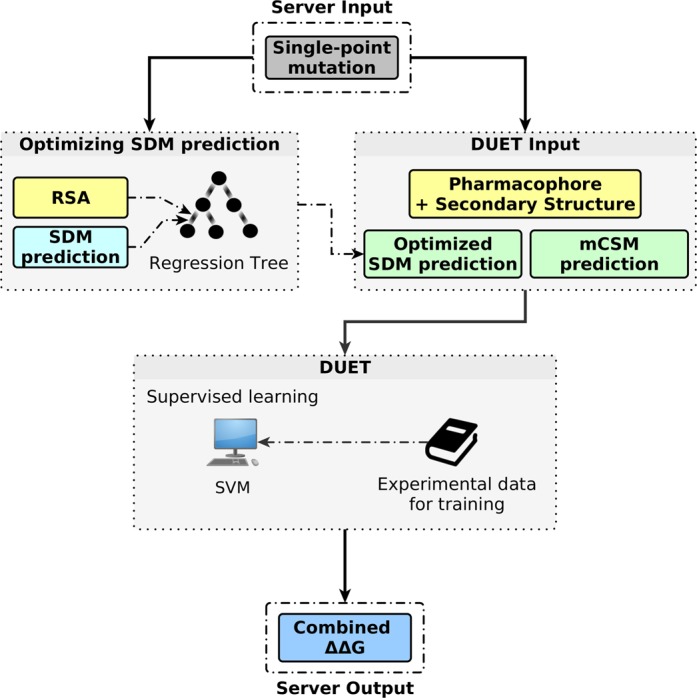
DUET workflow for obtaining a consensus prediction for a single point mutation. The grey and the blue boxes denote the server's input and output, respectively. Green boxes denote intermediate prediction values used by DUET and yellow boxes denote complementary information used to optimize SDM prediction or by DUET.