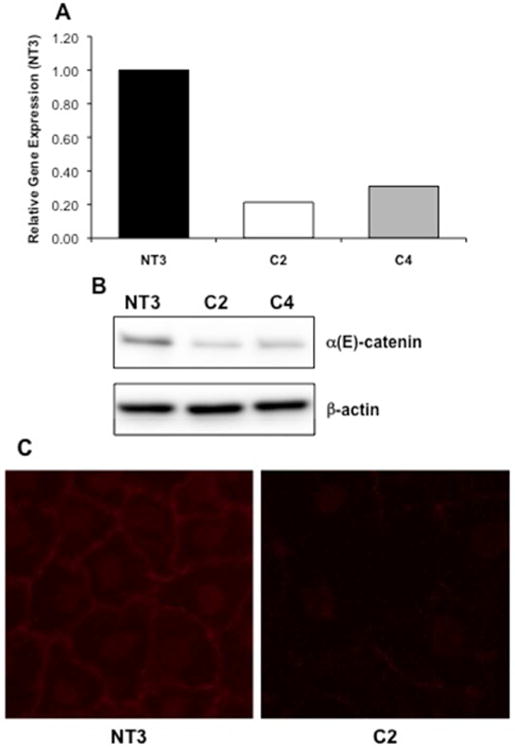
Figure 1. Characterization of Stable Knockdown of α(E)-Catenin in NRK-52E Cells.

A: Loss of α(E)-catenin gene expression in single cell clones generated from stable shRNA-mediated knockdown in NRK-52E cells (C2 and C4 cells) is seen as compared to the vector control cell line (NT3). B: A corresponding loss of protein expression is seen via western blot analysis. C: Immunofluorescence demonstrates typical cell membrane staining of α-catenin in the NT3 cells; staining is reduced in the C2 cells.
