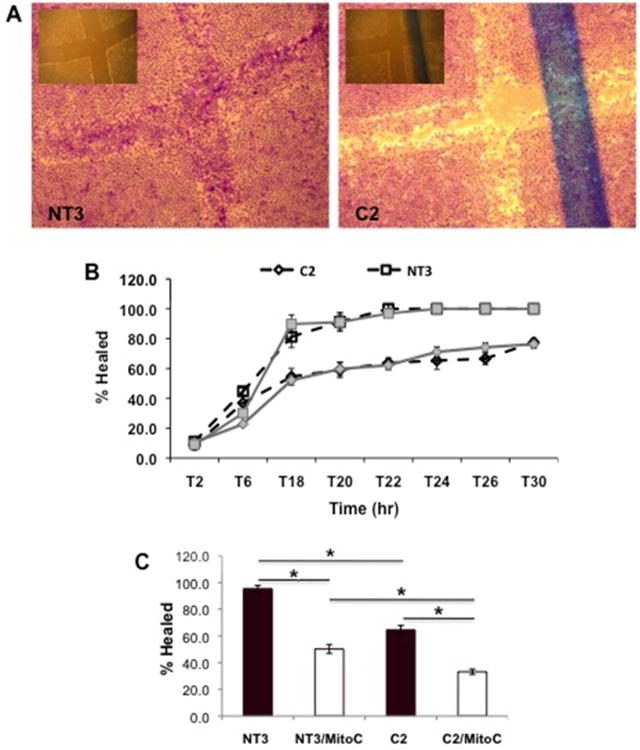
Figure 2. Loss of α(E)-Catenin Reduces Wound Healing.

A: Representative images of NT3 and C2 cells 24 hr following injury in serum-free conditions; the inset is the T0 timepoint. B: The time course of repair in NT3 and C2 cells is shown, * indicates a statistically significant difference between C2 and NT3, or C2 serum-free (SF) and NT3 SF. For the wound healing, each data point represents 5 measurements over 3 independent experiments; each data point represents the mean±SD. C: Wound healing at 24 hr in the presence of mitomycin C, which inhibits cell proliferation; each data point represents the mean+SD from 2 independent experiments (n=3 per experiment); * indicates a significant difference from respective control.
