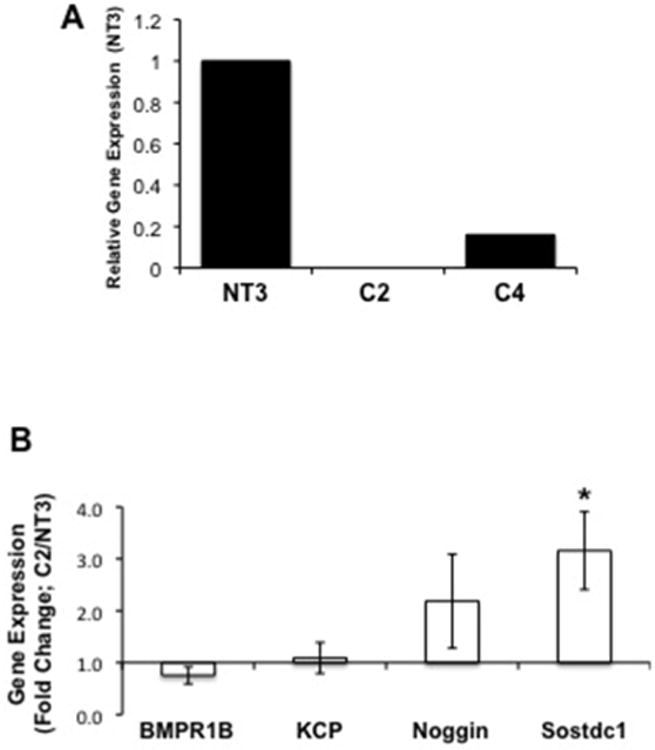
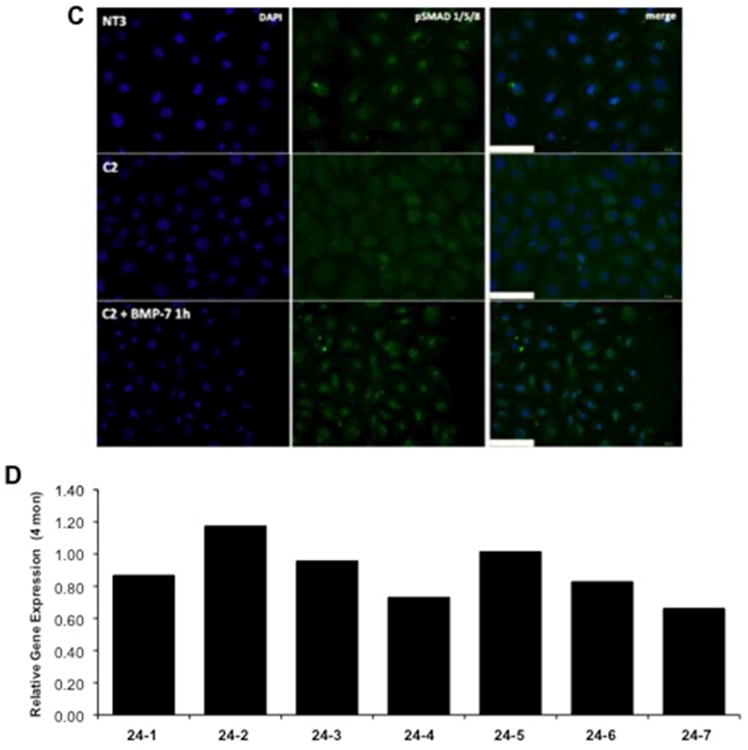
Figure 3. Loss of α(E)-Catenin Decreases BMP-7 Expression.


A: BMP-7 gene expression is reduced in C2 and C4 cells. Data is representative of three independent experiments. B: Gene expression of a BMPR1B, KCP, noggin and Sostdoc1 in NT3 and C2 cells was examined using quantitative PCR. each data point represents the mean+SD from 2 experiments, n=4 per experiment; * indicates a significant difference from respective control. C: Nuclear phosphoSmad 1/5/8 staining is decreased in C2 cells as compared to NT3 controls; addition of exogenous BMP-7 to C2 cells increases the staining. Data is representative of two independent experiments. D: Gene expression data in 24-mon old kidney samples demonstrates a trend of decreased BMP-7 expression; each bar represents the data from 1 of 7 individual animals compared to the mean of 8 4-month old samples.
