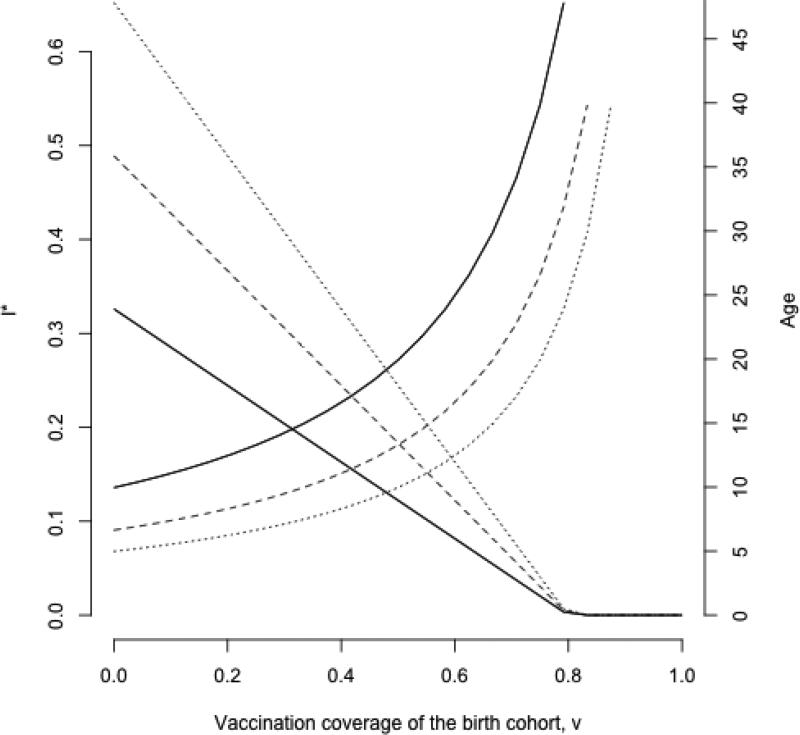
Figure 1.
In a classic SIR framework (here, dS/dt = μ(1 – v) – βSI – μS and dI/dt = βSI – gI – μI, where μ is the birth and death rate (total population size as taken as N=1), v is vaccination coverage of the birth cohort, and g is the generation time of the infection) the equilibrium proportion of infected individuals I* (y axis, left) is defined by I* = μ[(1 – v)R0 – 1]/β and thus declines with increasing vaccination coverage of the birth cohort (x axis). The average age of infection A increases (y axis, right), approximately following R0=G/A where G is the inverse of the birth rate. Different lines reflect 20, 30 or 40 births per 1000 (solid, dashed and dotted lines, respectively); other parameters are g is 18 days−1, and β=R0/(g+μ) with R0=5.

