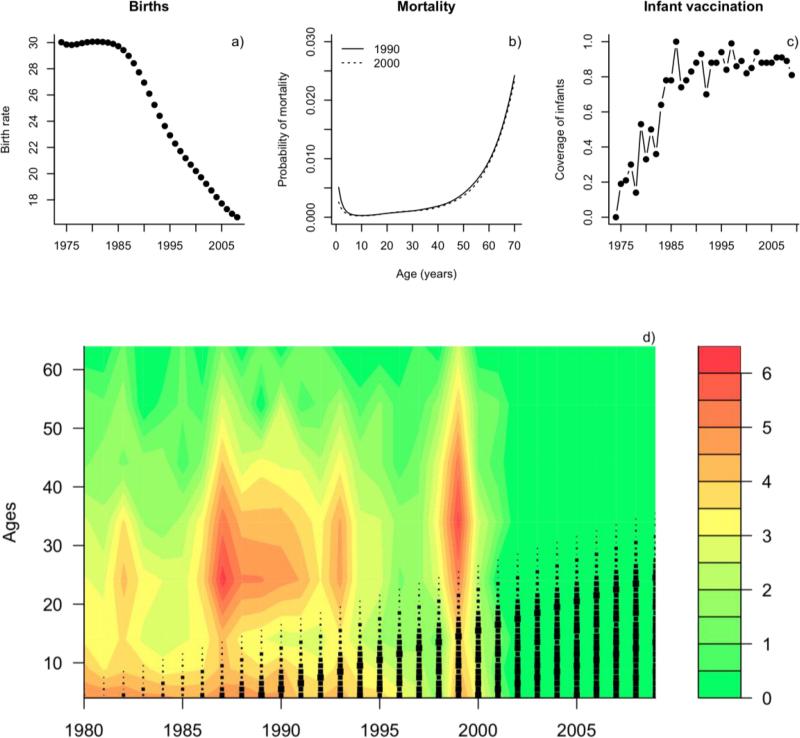
Figure 2.
Demographic, vaccination and infection characteristics of Costa Rica over the time-span considered including a) birth rate (from http://data.worldbank.org); b) mortality over age in 1990 and 2000 (from http://apps.who.int/ghodata/?vid=720; c) variation in coverage via infant vaccination through time; and d) rubella incidence over age across Costa Rica on a log scale (legend) in years following the introduction of vaccination. Black squares indicate the fraction of each cohort covered by routine infant vaccination (reflecting Fig. 1b). Older age outbreaks start at the upper limit of this line.

