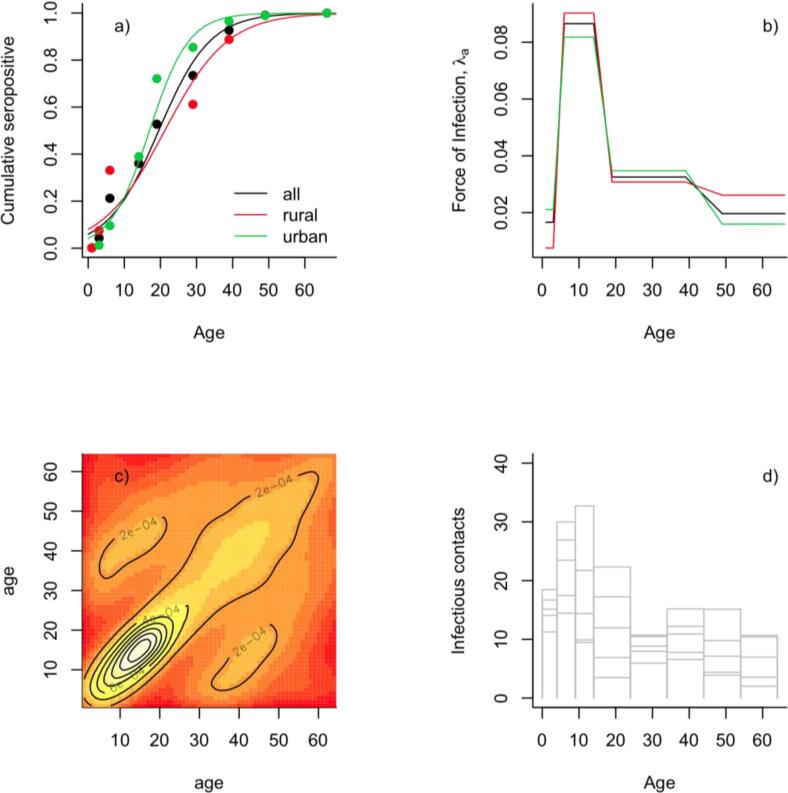
Figure 3.
a) Seroprofiles (points) of rubella pre-vaccination in 1969 (Villarejos et al., 1971), fitted with a logistic regression (lines) for rural communities, urban communities, and the entire country; the corresponding average age of infection (defined as −β0/βs where β0 is the intercept of the fitted logistic regression; and βs the slope) ranges between 17 and 21; b) corresponding age-specific FOI fitted with a catalytic model; c) log pattern of observed contacts across age (Mossong et al., 2008); d) profile of the expected FOI over age obtained by combining the age structure of the Costa Rican population between 1980 and 1985 with the age structure of infected individuals and the contact matrix shown in c).

