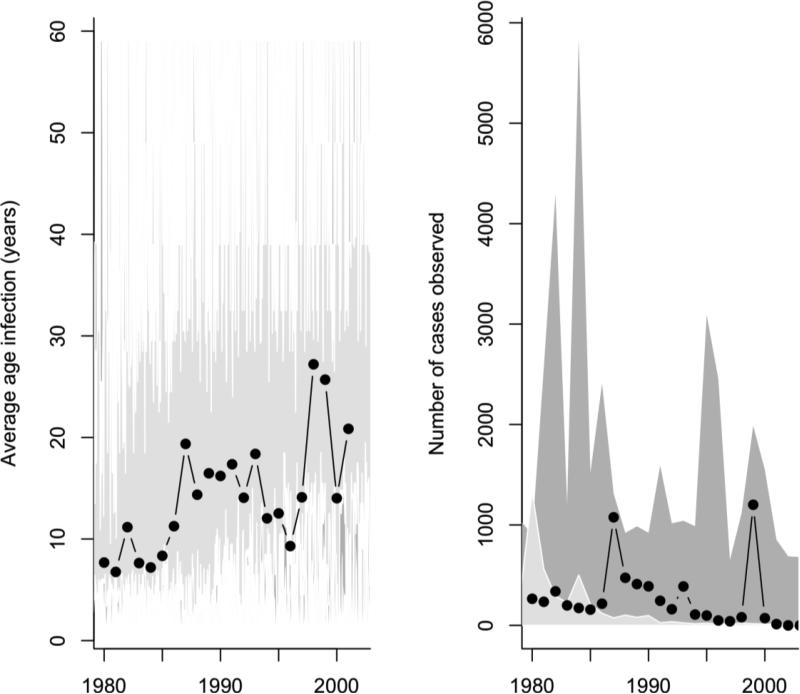
Figure 5.
The range of 50 stochastic simulations for R0=4, assuming on average one infected immigrant a year and vaccination coverage levels adjusted as described above (dark grey polygon) or following the observed (light grey polygons) with the observed (black lines) average age of infection (left) and number of cases observed (right). Simulated case numbers are re-scaled for comparison with the observed (right) by calculating a reporting rate so that the average number of cases simulated in 1980 reflects the observed number of cases, corresponding to pobs=0.02; we assume that this increases exponentially, reaching close to perfect reporting in 2008.

